On 15 October 2026 I had two fixes for one problem on my desk: a 4 g tube of ARCTIC MX-7 thermal paste and a 120 mm Noctua fan. The problem was my router, a fanless mini PC running OPNsense in a closed plywood cabinet. The day before, its CPU had touched 91 °C.
The advice I found online was to open the case and replace the paste. I fitted the fan first, because it needed no screwdriver. Before I did, I decided which result would send me back for the paste.
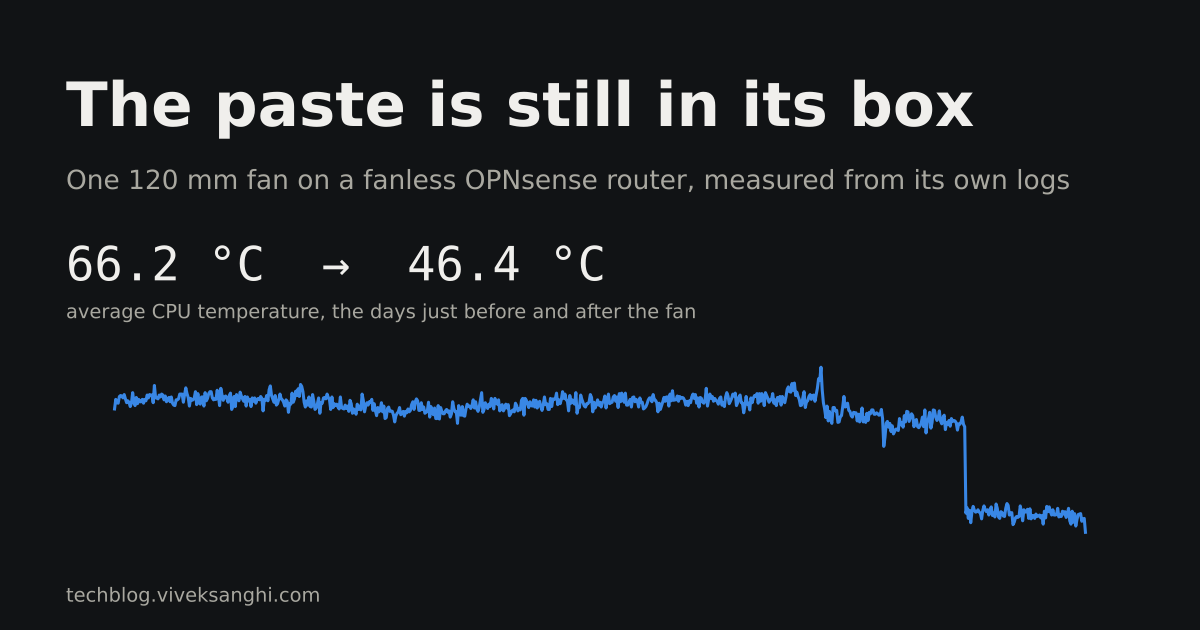
I never needed it. The router had been logging its own temperature all along. Between 16 September and the evening of 15 October, no hour averaged below 60 °C. In the four days after the fan went on, no hour averaged above 49 °C. The paste is still in its box.
I did this work with Claude, Anthropic’s AI model, which could read my router through my own browser session. I chose the parts, fitted the fan and set the rule. Claude pulled the temperature records and did the arithmetic, and on 28 October it read back the router’s hourly data for this post.
The box and the cabinet
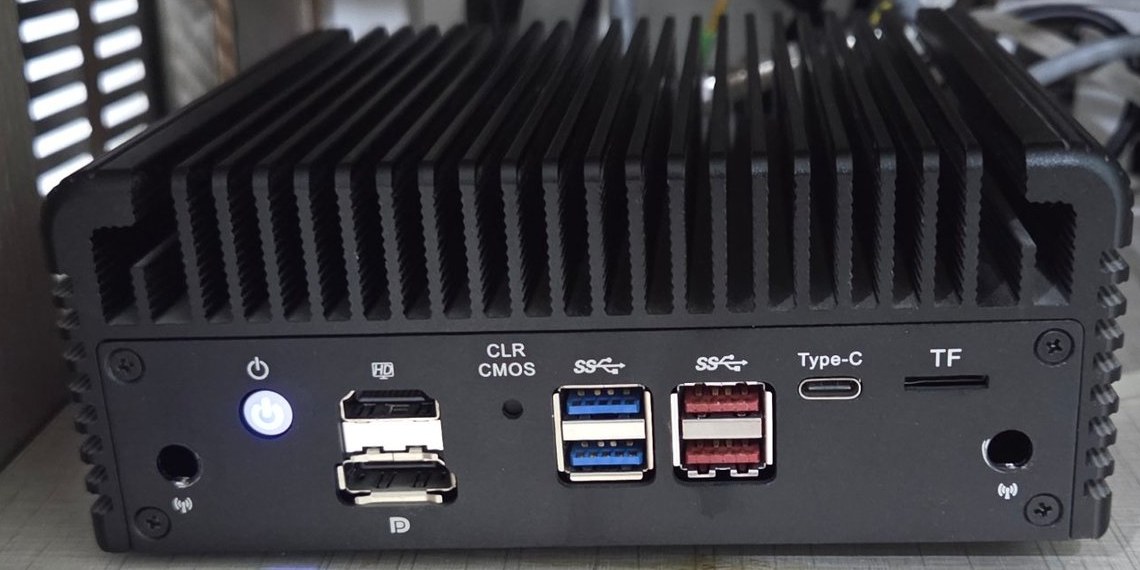
The router is a six-port fanless mini PC sold under the name “Shenzhen Weibu”. Inside is an Intel Pentium Gold 8505: one performance core and four efficient cores, six threads, 15 W base power and up to 55 W in turbo, according to Intel’s specification page. It has 20 GB of RAM and six Intel I226-V 2.5 GbE ports, and runs OPNsense 26.7. The case is the heatsink. Its top is a block of fins.
It sits in a closed plywood cabinet with other network gear. A slotted grille in the cabinet’s side panel is the only planned way out for warm air.
Was 91 °C dangerous? Not by Intel’s numbers. The same page lists the chip’s maximum junction temperature (TJUNCTION) as 100 °C, and a processor at that limit slows itself down rather than failing. The 91 °C was also only the highest sampled reading; the router reads the sensor once a minute, so the peaks in between went unrecorded. Even so, the heat had become a reason to look at a new router. The hourly average sat near 70 °C day and night, and the SSD, the memory and the network chips share the same hot case. Heat shortens the life of electronics in general, though I measured neither that nor the SSD’s temperature on this box.
Why the fan went first
A repaste is the usual advice for a hot mini PC, and it may well have helped. It would also have meant:
- a configuration backup first;
- 99 per cent isopropyl alcohol and lint-free wipes;
- 45 to 60 minutes with the network offline;
- opening a sealed case whose screws and thermal pads I had never seen.
A fan lying on the fins needed none of that, and could come off in a second. It has costs of its own. It gives up what a fanless box is for: no noise, no dust drawn in, no moving part to wear out.
So I set the rule before fitting it: repaste only if the overnight readings still reach the 80s with the fan in place.
The fan
I chose a Noctua NF-F12 5V PWM. Noctua’s specification gives 120 mm, 5 V, up to 1,500 rpm, 0.65 W typical and 22.4 dB(A) at full speed, with a USB power cable in the box. Mine plugs into one of the router’s own USB ports. Powered from USB, the fan gets no speed signal, and Noctua’s own guide says a PWM fan with no signal runs at full speed. Noctua marks it “5V PWM version, not for use in PCs”: a PC’s 12 V fan header is the wrong supply for it.
On my router, the 120 mm fan covers most of the top. Pick a fan about the size of the router’s top. Noctua also sells 5 V versions in smaller sizes, such as the 80 mm NF-A8 5V PWM. A cheaper 5 V USB fan would also move air; I have not tried one.
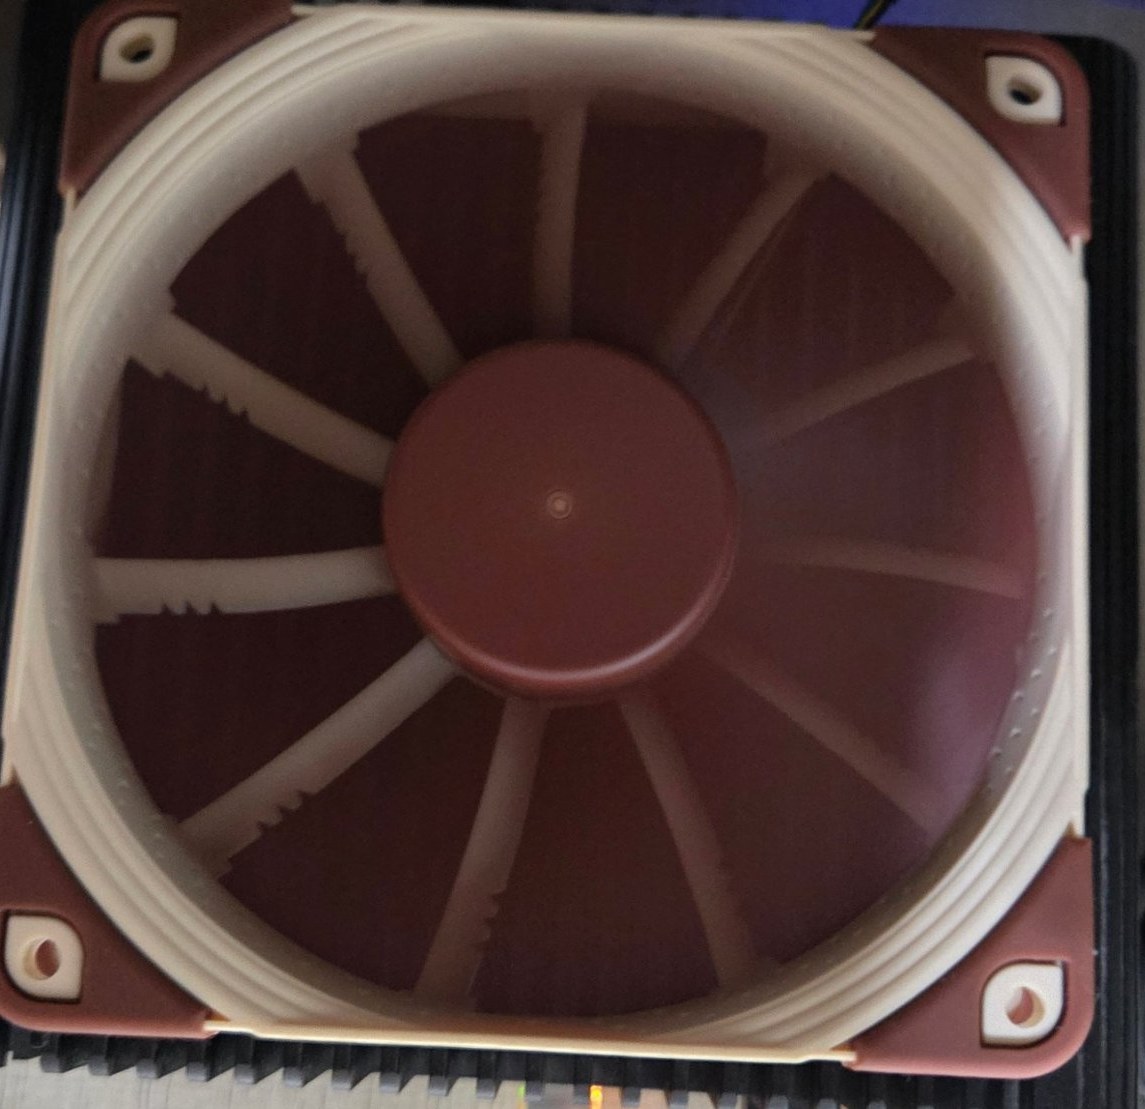
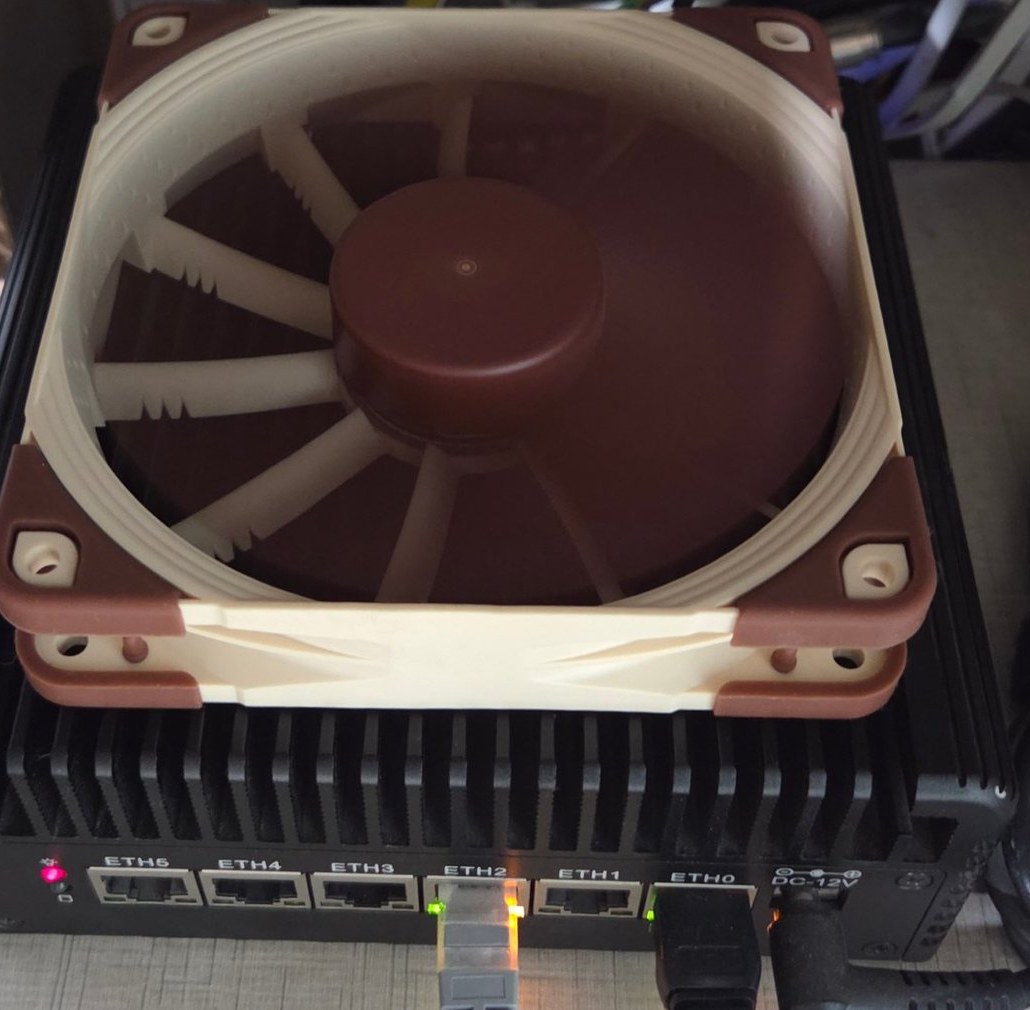
I fitted it at about 17:30 on 15 October. It lies flat on the top fins, not screwed down, blowing down into them. Reading a photo, Claude first had the airflow the wrong way round; I checked the arrow moulded into the frame. Either direction should help, but I wanted to know which one I was measuring.
What the router recorded
OPNsense reads the CPU temperature once a minute and keeps hourly averages for weeks. How to read yours is further down.
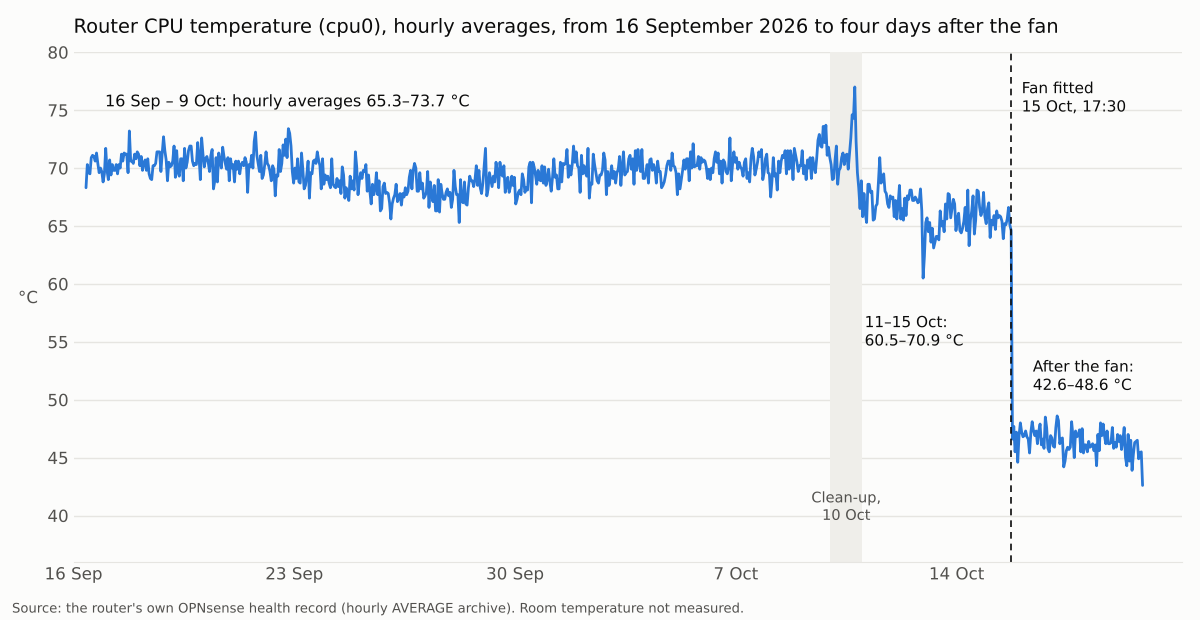
Hourly averages of cpu0, from the router’s hourly archive:
| Period | Hours | Average | Lowest hour | Highest hour |
|---|---|---|---|---|
| 16 September – 9 October | 567 | 69.7 °C | 65.3 °C | 73.7 °C |
| 11 October – 15 October, until the fan | 114 | 66.2 °C | 60.5 °C | 70.9 °C |
| 15 October, after the fan (four days) | 100 | 46.4 °C | 42.6 °C | 48.6 °C |
I left out 10 October, the day of a configuration clean-up described below. Against the days just before it, the fan took about 20 °C off the average. The before and after ranges do not overlap: the coolest hour before the fan was 12 °C warmer than the warmest hour after it.
The rule I had set was about the overnight readings. On 15 October I read the 03:00–10:00 window from the per-minute record, and on 16 October I read the same window again:
cpu0, 03:00–10:00 |
15 October, no fan | 16 October, fan |
|---|---|---|
| Average | 65.6 °C | 46.7 °C |
| Maximum | 90.3 °C | 73.6 °C |
| Readings at 80 °C or above | 19 | 0 |
No reading reached the 80s. The rule said leave the case shut.
My rule used single readings, and single readings jump. Each is one instant: on 28 October consecutive minutes read 35.3, 68.2, 69.0 and 35.7 °C. An average over hours would have made a better test. By hourly averages the gap is wider still: no hour after the fan went above 48.6 °C.
Deep dive: the 15 October per-minute windows
Read from the per-minute record on 15 October.
| Window, 15 October 2026 | Readings | Average | Median | 95th percentile | Maximum | At 80 °C or above |
|---|---|---|---|---|---|---|
| 03:00–10:00, no fan | 420 | 65.6 °C | 69.0 °C | 79.8 °C | 90.3 °C | 19 |
| 12:00–17:20, no fan | 320 | 65.5 °C | 68.7 °C | 80.1 °C | 90.7 °C | 16 |
| 17:31–19:12, fan | 101 | 46.0 °C | 48.7 °C | 60.5 °C | 69.6 °C | 0 |
| 19:20–19:37, after a firmware update and reboot | 17 | 54.1 °C | 57.1 °C | 70.8 °C | 70.8 °C | 0 |
The last row is higher because the router had just rebooted after a firmware update and was loading about 2.7 million blocklist entries. It is not a resting figure.
What this does and does not show
It shows that a fan was enough here. It does not show that a repaste would not also have helped; I never tried one. The fan does not take heat out of the cabinet. It forces cabinet air through the router’s fins. The closed cabinet made the starting point worse, so the gain here is probably larger than it would be in open air.
- I did not measure the room temperature. The drop came within one hour, and a room does not cool 20 °C in an hour. The router also reacts little to the daily cycle: from 16 September to 9 October, the average for each hour of the day stayed between 69.2 and 70.3 °C, a swing of about 1 °C.
- The firmware changed the same evening. The router installed a firmware update at 19:12 on 15 October. The drop came first: the 101 minutes between fitting the fan and the update averaged 46.0 °C.
- A configuration clean-up came five days earlier. On 10 October I removed a WireGuard VPN client, an unused proxy stack (Squid, ClamAV, Redis and their companions) and the NAT rules that fed it, trimmed my DNS blocklists, and unplugged a USB network adapter. The hourly average was 69.7 °C from 16 September to 9 October and 66.2 °C from 11 October until the fan. That fall came in steps over three or four days, and I cannot separate those changes from the weather. It is why the comparison above uses only the days just before the fan.
- No power settings changed. The router’s configuration history goes back to 13 October (30 revisions) and shows no change to power settings, thermal settings or tunables in that time.
- I did not control the load. These are ordinary days on a home network.
- It is one router in one cabinet.
A hunch I did not prove: the dashboard
On 13 October, with about 20 hours of uptime, I compared CPU time by process. Unbound, the DNS resolver, had used 16 seconds, about 0.02 per cent of one core, while answering about 10,000 unwanted lookups a day from devices on the network. The PHP processes that serve the web interface and the API had used 5 minutes 9 seconds, about 20 times as much, and that snapshot misses PHP workers that had already exited.
Even so, 5 minutes in 20 hours is about 0.4 per cent of one core. If the open dashboard, whose widgets refresh every few seconds, raised the temperature, it did so in short bursts. I suspected those bursts behind some 78 °C spikes I saw that week. I did not test it.
Reading your own router
OPNsense draws its health records under Reporting → Health. To look at the CPU temperature graph:
- Open the router’s web interface in a browser: type the address you use to manage the router into the address bar, press Enter, and log in. If you do not know the address, ask whoever set the router up. A router uses its own security certificate, so the browser may warn that the connection is not private; for your own router’s address that is expected. Click Advanced, then the link that continues to the address (Proceed in Chrome, Accept the Risk and Continue in Firefox).
- In the menu, open Reporting → Health. The page loads in a few seconds and changes nothing. It lists its reports by topic.
- Find the CPU temperature report in the page’s list of reports. If there is none, open System → Settings → Miscellaneous → Thermal Sensors; mine is set to “Intel Core CPU on-die thermal sensor (coretemp)”. Changing that setting changes the router: write down the old value first, press Save*, and wait a few minutes while the router takes its readings. To undo it, choose the old value again; setting it back to none needs a reboot.
The same data comes from the router’s API, at GET /api/diagnostics/systemhealth/get_system_health/cputemp-system/0. The number at the end picks an archive: /0 is one value a minute, and higher numbers are coarser. How long each lasts depends on when the router’s temperature database was created:
| Archive | My router (database from an older OPNsense) | A new OPNsense 26.x install |
|---|---|---|
/0 |
1 minute, 1,000 slots: 16 hours 40 minutes | 1 minute, 1,200 slots: 20 hours |
/1 |
5 minutes, 1,000 slots: about 3½ days | 5 minutes, 720 slots: 60 hours |
/2 |
1 hour, 1,000 slots: about 6 weeks | 1 hour, 1,860 slots: about 11 weeks |
/3 |
12 hours, 3,000 slots: about 4 years | 1 day, 2,284 slots: about 6 years |
OPNsense keeps an existing database through upgrades, so an older router keeps the older layout. The last column is from the 26.7 source code; I have not seen a new install.
Two things follow. Read last night’s per-minute record this morning; by the evening those minutes are gone, and only the coarser averages remain. And the hourly archive is long enough for a before-and-after you did not plan. Mine already held a month of “before” when I fitted the fan.
Deep dive: what the archives hold, and why hourly figures hide spikes
The API serves only averages. OPNsense’s fetchData.py processes only the round-robin archives whose consolidation function is AVERAGE, and builds one “set” per archive. The router stores one instant reading of the sensor each minute; each hourly value is the average of those readings. A single reading of 91 °C barely moves it.
Slots with no reading come back as empty values. The same script drops empty slots only at the start of a series. So the count of slots understates the archive’s length when its oldest slots are empty, as on a young database. The snippet below reports readings and empty slots separately.
Deep dive: a console snippet to summarise your own router (for a PC)
The Health graph shows the shape. This prints the numbers: the average, median, 95th percentile and maximum, and how many readings reached 80 °C, for one archive. It sends one read request (a GET) to the router’s own health API and changes nothing.
Before you start
- You need a PC with Chrome or Firefox, and a login to the router’s web interface that can open Reporting → Health.
- You type in the browser’s developer console, on the router’s own page. You install nothing.
- It takes two to three minutes.
- It changes nothing on the router or the PC, so there is nothing to undo. Close the console when you finish.
- In the boxes below, Copy copies the whole box. A dashed box shows what you should see; you do not type it.
Steps
- Open the router’s web interface in Chrome or Firefox: type the address you use to manage the router into the address bar, press Enter, and log in. You should see the OPNsense dashboard. If no login page appears, check the address and that the PC is on the home network. If the browser warns that the connection is not private, see the note in step 1 of the graph steps above.
- Stay on any OPNsense page and open the browser console: Ctrl+Shift+J in Chrome or Ctrl+Shift+K in Firefox on Windows and Linux; Cmd+Option+J or Cmd+Option+K on a Mac. A panel opens beside or below the page, with a line to type on. If it opens on another tab, click the Console tab.
-
Click Copy in the box below. It copies the whole snippet.
// Paste into the browser console on any OPNsense page while logged in. // Read-only: one GET to the router's own health API. Changes nothing. (async () => { const LEVEL = 0; // archive: 0 is the finest (one value a minute); higher numbers are coarser. How many exist depends on the router. const url = '/api/diagnostics/systemhealth/get_system_health/cputemp-system/' + LEVEL; let d; try { const r = await fetch(url); if (r.status === 401) { console.log('HTTP 401: not logged in. Log in to the OPNsense web interface in this browser, then paste again.'); return; } if (r.status === 403) { console.log('HTTP 403: logged in, but this user may not read Reporting > Health. Use an account with that privilege.'); return; } if (!r.ok) { console.log('HTTP ' + r.status + ' from ' + url); return; } d = await r.json(); } catch (e) { console.log('No JSON came back (' + e.message + '). Run this on an OPNsense page while logged in.'); return; } const series = d && d.set && d.set.data && d.set.data[0]; if (!series || !Array.isArray(series.values)) { console.log('No temperature series at LEVEL ' + LEVEL + '. A higher LEVEL may not exist on this router; at LEVEL 0, check that Reporting > Health shows a CPU temperature graph.'); return; } const pts = series.values.filter(p => p[1] !== null && !isNaN(p[1])); const empty = series.values.length - pts.length; if (pts.length === 0) { console.log('The series ' + series.key + ' has no readings at this level.'); return; } const v = pts.map(p => p[1]).sort((a, b) => a - b); const n = v.length; const median = n % 2 ? v[(n - 1) / 2] : (v[n / 2 - 1] + v[n / 2]) / 2; const p95 = v[Math.min(n - 1, Math.ceil(0.95 * n) - 1)]; // nearest-rank const when = t => new Date(t).toLocaleString(); // your browser's time zone; each time marks the end of its interval console.log('Series ' + series.key + ', one value every ' + d.set.step_size + ' s'); console.log('From ' + when(pts[0][0]) + ' to ' + when(pts[n - 1][0]) + ': ' + n + ' readings, ' + empty + ' empty slots'); console.log('Average ' + (v.reduce((a, b) => a + b, 0) / n).toFixed(1) + ' °C, median ' + median.toFixed(1) + ', 95th percentile ' + p95.toFixed(1) + ', maximum ' + v[n - 1].toFixed(1)); console.log('Readings at 80 °C or above: ' + v.filter(x => x >= 80).length); })(); -
Click the line in the console, paste with Ctrl+V (Cmd+V on a Mac) and press Enter. Browsers may block pasting into the console, because pasting a stranger’s code into a logged-in page is a known trick. Read the snippet before you allow it. If the browser asks you to type “allow pasting”, do what its message says, then paste again.
-
Within a second or two you should see four lines (ignore a line that starts with “Promise”): the series name, the time range with the number of readings and empty slots, the summary figures, and the count of readings at 80 °C or above. Times are in your browser’s time zone, and each marks the end of its interval. On my router, on 28 October 2026, it printed this (I left out the times; their format follows your browser’s settings):
Series cpu0temp, one value every 60 s From <start time> to <end time>: 1000 readings, 0 empty slots Average 43.9 °C, median 47.7, 95th percentile 57.8, maximum 72.5 Readings at 80 °C or above: 0 -
“HTTP 401” means the browser is not logged in to OPNsense: log in and repeat step 4. “HTTP 403” means you are logged in as a user without access to Reporting → Health.
- To read the hourly archive, paste the snippet into a plain text editor first (Notepad on Windows, TextEdit set to plain text on a Mac), change
const LEVEL = 0;toconst LEVEL = 2;, copy all of it from there, and repeat steps 4 and 5. - Compare the average with the level of the Reporting → Health graph for the same archive. They should agree.
- When you finish, close the panel with the × at its top right. Nothing was changed on the router.
The verdict
The case stays shut and the paste stays in its box.
What is left is small. Fasten the fan, and lift it: rubber feet of 10 to 15 mm would hold it in place and let air reach the fins under its hub, which a fan lying flat starves. That is general practice for fans over heatsinks; I have not measured it here. Keep the side grille clear. The cabinet as a whole is a separate problem: the fan can cool the router only towards the temperature of the cabinet air, which is warmer than the room. I worked through that separately and may write it up.
Before the fan, the heat was a reason to look at a new router. It is not any more.
What I would tell someone with a fanless box in a warm cupboard
- Read what the router already records before you open anything. On OPNsense that is Reporting → Health, or the API above.
- Check how long each archive lasts on your router. It depends on when its database was created.
- Decide which result sends you to the next step, before you change anything.
- Judge averages, not single readings. Consecutive minute readings can differ by 30 °C.
- Try the cheap, reversible fix first, and weigh what it costs: a fan brings noise and dust to a box bought to have neither.
Glossary
- Fanless (passive) cooling: the case is the heatsink; heat leaves by conduction and natural airflow, with no fan.
- Thermal paste / repaste: the compound between the CPU and the heatsink that fills microscopic gaps. Repasting means cleaning off the old compound and applying new.
- P-core / E-core: Intel’s performance and efficient cores in one chip. The Pentium Gold 8505 has one of the first and four of the second.
- TJUNCTION: the highest temperature Intel allows at the chip itself. For the 8505 it is 100 °C.
- PWM: pulse-width modulation; a signal wire that tells a fan how fast to spin.
- Round-robin database (RRD): a fixed-size store that keeps recent data at fine resolution and older data as coarser averages, overwriting the oldest.
- Median / 95th percentile: the median is the middle reading (or the average of the two middle readings); 95 per cent of readings are at or below the 95th percentile.
- API: the router’s programming interface; the same data the web pages show, returned as JSON.
- Tunables: kernel settings that OPNsense applies at boot, listed under System → Settings → Tunables.
Paste अब भी अपने डिब्बे में है
15 अक्टूबर 2026 को मेरी मेज़ पर एक ही समस्या के दो इलाज रखे थे: ARCTIC MX-7 thermal paste की 4 g की ट्यूब और 120 mm का एक Noctua fan। समस्या मेरा router था: एक fanless mini PC, जो बंद plywood कैबिनेट में OPNsense चलाता है। एक दिन पहले उसका CPU 91 °C तक पहुँच गया था।
ऑनलाइन जो सलाह मिली, वह यही थी कि case खोलो और paste बदल दो। मैंने पहले fan लगाया, क्योंकि उसके लिए screwdriver नहीं चाहिए था। लगाने से पहले मैंने तय कर लिया कि कौन-सा नतीजा मुझे वापस paste की ओर भेजेगा।
उसकी ज़रूरत नहीं पड़ी। Router शुरू से अपना तापमान खुद दर्ज कर रहा था। 16 सितंबर से 15 अक्टूबर की शाम तक किसी भी घंटे का औसत 60 °C से नीचे नहीं गया। Fan लगने के बाद के चार दिनों में किसी भी घंटे का औसत 49 °C से ऊपर नहीं गया। Paste अब भी अपने डिब्बे में है।
यह काम मैंने Anthropic के AI मॉडल Claude के साथ किया, जो मेरे अपने browser session के ज़रिए मेरा router पढ़ सकता था। Parts मैंने चुने, fan मैंने लगाया और नियम मैंने तय किया। तापमान के रिकॉर्ड Claude ने निकाले और हिसाब उसी ने लगाया। 28 अक्टूबर को इस पोस्ट के लिए उसने router का hourly data दोबारा पढ़ा।
Box और कैबिनेट
यह router छह port वाला fanless mini PC है, जो “Shenzhen Weibu” नाम से बिकता है। अंदर Intel Pentium Gold 8505 है: एक performance core और चार efficient cores, छह threads, 15 W base power और turbo में 55 W तक, Intel के specification पेज के अनुसार। इसमें 20 GB RAM और छह Intel I226-V 2.5 GbE ports हैं, और यह OPNsense 26.7 चलाता है। इसका case ही heatsink है। ऊपर का हिस्सा fins का एक ब्लॉक है।
यह दूसरे network उपकरणों के साथ एक बंद plywood कैबिनेट में रखा है। कैबिनेट के साइड पैनल में झिरियों वाली एक ग्रिल ही गर्म हवा के निकलने का तय रास्ता है।
क्या 91 °C ख़तरनाक था? Intel के आँकड़ों के हिसाब से नहीं। उसी पेज पर chip का अधिकतम junction तापमान (TJUNCTION) 100 °C दिया है, और उस सीमा पर processor ख़राब होने के बजाय अपनी रफ़्तार घटा लेता है। एक बात और: 91 °C सिर्फ़ उन readings में सबसे ऊँचा था जो router ने लीं; router sensor को मिनट में एक बार पढ़ता है, इसलिए बीच के peaks दर्ज नहीं हुए। फिर भी यह गर्मी नया router देखने की एक वजह बन गई थी। Hourly औसत दिन-रात 70 °C के आसपास रहता था, और SSD, memory और network chips उसी गर्म case में हैं। गर्मी आम तौर पर electronics की उम्र घटाती है, हालाँकि इस box पर मैंने न यह नापा, न SSD का तापमान।
Fan पहले क्यों
गर्म mini PC के लिए repaste आम सलाह है, और काफ़ी मुमकिन है कि उससे फ़ायदा होता। पर उसके लिए यह सब करना पड़ता:
- पहले configuration का backup;
- 99 प्रतिशत isopropyl alcohol और रेशे न छोड़ने वाले wipes;
- 45 से 60 मिनट तक network बंद;
- एक sealed case खोलना, जिसके screws और thermal pads मैंने कभी नहीं देखे थे।
Fins पर रखे fan के लिए इनमें से कुछ नहीं चाहिए था, और उसे एक सेकंड में हटाया जा सकता था। उसके अपने नुक़सान भी हैं। वह वही छीन लेता है जिसके लिए fanless box लिया जाता है: न शोर, न खिंचकर आती धूल, न घिसने वाला कोई हिस्सा।
इसलिए लगाने से पहले मैंने नियम तय किया: repaste तभी, जब fan लगे होने पर भी रात की readings 80 या उससे ऊपर पहुँचें।
Fan
मैंने Noctua NF-F12 5V PWM चुना। Noctua के specification के अनुसार यह 120 mm, 5 V, अधिकतम 1,500 rpm, सामान्यतः 0.65 W और पूरी रफ़्तार पर 22.4 dB(A) का है, और डिब्बे में USB power cable आती है। मेरा fan router के अपने ही एक USB port में लगा है। USB से चलाने पर fan को रफ़्तार का कोई signal नहीं मिलता, और Noctua की अपनी guide कहती है कि बिना signal के PWM fan पूरी रफ़्तार पर चलता है। Noctua इस पर “5V PWM version, not for use in PCs” लिखता है, यानी यह 5V PWM संस्करण है, PC में इस्तेमाल के लिए नहीं: PC का 12 V fan header इसके लिए ग़लत supply है।
मेरे router पर 120 mm का fan ऊपरी सतह का ज़्यादातर हिस्सा ढक लेता है। Router के ऊपरी हिस्से के लगभग बराबर आकार का fan चुनें। Noctua छोटे आकारों में भी 5 V संस्करण बेचता है, जैसे 80 mm का NF-A8 5V PWM। कोई सस्ता 5 V USB fan भी हवा चलाएगा; मैंने ऐसा कोई fan आज़माया नहीं।
मैंने इसे 15 अक्टूबर को लगभग 17:30 पर लगाया। यह ऊपर के fins पर सपाट रखा है, screws से कसा नहीं है, और हवा नीचे fins में फेंकता है। एक फ़ोटो पढ़ते हुए Claude ने पहले हवा की दिशा उल्टी बताई; मैंने frame पर बना तीर देखा। किसी भी दिशा में हवा चले, मदद मिलनी चाहिए, पर मैं जानना चाहता था कि मैं किस दिशा को नाप रहा हूँ।
Router ने क्या दर्ज किया
OPNsense CPU तापमान मिनट में एक बार पढ़ता है और hourly औसत हफ़्तों तक रखता है। अपने router का तापमान कैसे पढ़ें, यह आगे है।
cpu0 के hourly औसत, router के hourly archive से:
| अवधि | घंटे | औसत | सबसे ठंडा घंटा | सबसे गर्म घंटा |
|---|---|---|---|---|
| 16 सितंबर – 9 अक्टूबर | 567 | 69.7 °C | 65.3 °C | 73.7 °C |
| 11 अक्टूबर – 15 अक्टूबर, fan लगने तक | 114 | 66.2 °C | 60.5 °C | 70.9 °C |
| 15 अक्टूबर, fan के बाद (चार दिन) | 100 | 46.4 °C | 42.6 °C | 48.6 °C |
10 अक्टूबर मैंने छोड़ दिया है; उस दिन की configuration की सफ़ाई का ज़िक्र नीचे है। ठीक पहले के दिनों की तुलना में fan ने औसत लगभग 20 °C घटाया। पहले और बाद के दायरे एक-दूसरे को छूते नहीं: fan से पहले का सबसे ठंडा घंटा, बाद के सबसे गर्म घंटे से 12 °C ज़्यादा गर्म था।
मैंने जो नियम तय किया था, वह रात की readings के बारे में था। 15 अक्टूबर को मैंने per-minute रिकॉर्ड से 03:00–10:00 का समय पढ़ा, और 16 अक्टूबर को वही समय फिर पढ़ा:
cpu0, 03:00–10:00 |
15 अक्टूबर, बिना fan | 16 अक्टूबर, fan के साथ |
|---|---|---|
| औसत | 65.6 °C | 46.7 °C |
| अधिकतम | 90.3 °C | 73.6 °C |
| 80 °C या उससे ऊपर की readings | 19 | 0 |
कोई reading 80 या उससे ऊपर नहीं पहुँची। नियम के मुताबिक़ case बंद ही रहना था।
मेरा नियम अकेली readings पर टिका था, और अकेली readings उछलती हैं। हर reading एक पल की होती है: 28 अक्टूबर को लगातार मिनटों में 35.3, 68.2, 69.0 और 35.7 °C दर्ज हुए। घंटों का औसत बेहतर कसौटी होता। Hourly औसत के हिसाब से अंतर और भी बड़ा है: fan के बाद कोई घंटा 48.6 °C से ऊपर नहीं गया।
गहराई से: 15 अक्टूबर के per-minute समय-खंड
15 अक्टूबर को per-minute रिकॉर्ड से पढ़ा गया।
| समय, 15 अक्टूबर 2026 | Readings | औसत | Median | 95th percentile | अधिकतम | 80 °C या ऊपर |
|---|---|---|---|---|---|---|
| 03:00–10:00, बिना fan | 420 | 65.6 °C | 69.0 °C | 79.8 °C | 90.3 °C | 19 |
| 12:00–17:20, बिना fan | 320 | 65.5 °C | 68.7 °C | 80.1 °C | 90.7 °C | 16 |
| 17:31–19:12, fan के साथ | 101 | 46.0 °C | 48.7 °C | 60.5 °C | 69.6 °C | 0 |
| 19:20–19:37, firmware update और reboot के बाद | 17 | 54.1 °C | 57.1 °C | 70.8 °C | 70.8 °C | 0 |
आख़िरी पंक्ति ज़्यादा है, क्योंकि router अभी-अभी firmware update के बाद reboot हुआ था और लगभग 27 लाख blocklist entries लोड कर रहा था। यह आराम की स्थिति का आँकड़ा नहीं है।
यह क्या दिखाता है और क्या नहीं
यह दिखाता है कि यहाँ एक fan काफ़ी था। इससे यह साबित नहीं होता कि repaste से भी फ़ायदा न होता; मैंने उसे कभी आज़माया नहीं। Fan कैबिनेट से गर्मी बाहर नहीं निकालता। वह कैबिनेट की हवा को router के fins के बीच से धकेलता है। बंद कैबिनेट ने शुरुआती स्थिति को और बिगाड़ा था, इसलिए यहाँ का फ़ायदा शायद खुली हवा में होने वाले फ़ायदे से ज़्यादा है।
- मैंने कमरे का तापमान नहीं नापा। गिरावट एक घंटे के भीतर आई, और कोई कमरा एक घंटे में 20 °C ठंडा नहीं होता। साथ ही, router पर दिन-रात के चक्र का असर कम पड़ता है: 16 सितंबर से 9 अक्टूबर तक दिन के हर घंटे का औसत 69.2 और 70.3 °C के बीच रहा, यानी लगभग 1 °C का उतार-चढ़ाव।
- उसी शाम firmware बदला। Router पर 15 अक्टूबर को 19:12 पर firmware update हुआ। गिरावट पहले आई: fan लगने और update के बीच के 101 मिनटों का औसत 46.0 °C था।
- Configuration की सफ़ाई पाँच दिन पहले हुई थी। 10 अक्टूबर को मैंने एक WireGuard VPN client हटाया, बिना इस्तेमाल पड़ा एक proxy stack (Squid, ClamAV, Redis और उनके साथी) और उसे traffic भेजने वाले NAT rules हटाए, अपनी DNS blocklists छाँटीं, और एक USB network adapter निकाल दिया। Hourly औसत 16 सितंबर से 9 अक्टूबर तक 69.7 °C था और 11 अक्टूबर से fan लगने तक 66.2 °C। यह गिरावट तीन-चार दिनों में क़दम-दर-क़दम आई, और मैं उन बदलावों के असर को मौसम से अलग नहीं कर सकता। इसी वजह से ऊपर की तुलना में सिर्फ़ fan से ठीक पहले के दिन लिए गए हैं।
- कोई power settings नहीं बदलीं। Router का configuration history 13 अक्टूबर से शुरू होता है (30 revisions) और तब से power settings, thermal settings या tunables में कोई बदलाव नहीं दिखाता।
- मैंने load को नियंत्रित नहीं किया। ये घर के network के आम दिन हैं।
- यह सिर्फ़ एक router है, एक ही कैबिनेट में।
एक अनुमान जो मैंने साबित नहीं किया: dashboard
13 अक्टूबर को, लगभग 20 घंटे के uptime पर, मैंने process के हिसाब से CPU time की तुलना की। DNS resolver Unbound ने 16 सेकंड लिए थे, यानी एक core का लगभग 0.02 प्रतिशत, जबकि वह network के devices से रोज़ आने वाले लगभग 10,000 अनचाहे lookups का जवाब दे रहा था। Web interface और API चलाने वाले PHP processes ने 5 मिनट 9 सेकंड लिए थे, लगभग 20 गुना, और उस snapshot में वे PHP workers नहीं गिने गए जो तब तक बंद हो चुके थे।
फिर भी, 20 घंटों में 5 मिनट एक core का लगभग 0.4 प्रतिशत है। अगर खुले dashboard ने, जिसके widgets हर कुछ सेकंड में refresh होते हैं, तापमान बढ़ाया, तो छोटे-छोटे झटकों में बढ़ाया। उस हफ़्ते दिखे कुछ 78 °C वाले spikes के पीछे मुझे इन्हीं झटकों का शक था। मैंने इसकी जाँच नहीं की।
अपने router को पढ़ना
OPNsense अपने health रिकॉर्ड Reporting → Health में ग्राफ़ के रूप में दिखाता है। CPU तापमान का ग्राफ़ देखने के लिए:
- Browser में router का web interface खोलें: address bar में वह पता लिखें जिससे आप router का प्रबंधन करते हैं, Enter दबाएँ, और log in करें। अगर आपको पता न मालूम हो, तो जिसने router लगाया था उससे पूछ लें। Router अपना ही security certificate इस्तेमाल करता है, इसलिए browser चेतावनी दे सकता है कि connection private नहीं है; आपके अपने router के पते के लिए यह अपेक्षित है। Advanced पर click करें, फिर उस link पर जो पते पर आगे बढ़ाता है (Chrome में Proceed, Firefox में Accept the Risk and Continue)।
- Menu में Reporting → Health खोलें। पेज कुछ सेकंड में लोड होता है और कुछ नहीं बदलता। यह अपनी reports को विषय के हिसाब से सूचीबद्ध करता है।
- पेज की reports की सूची में CPU तापमान की report ढूँढें। अगर कोई न हो, तो System → Settings → Miscellaneous → Thermal Sensors खोलें; मेरे यहाँ यह “Intel Core CPU on-die thermal sensor (coretemp)” पर सेट है। इस setting को बदलने से router बदल जाता है: पहले पुराना मान लिख लें, Save* दबाएँ, और कुछ मिनट रुकें जब तक router अपनी readings न ले ले। इसे पलटने के लिए पुराना मान फिर चुनें; इस setting को वापस none पर करने के लिए reboot चाहिए।
यही data router के API से भी मिलता है, GET /api/diagnostics/systemhealth/get_system_health/cputemp-system/0 पर। आख़िर का अंक एक archive चुनता है: /0 में हर मिनट का एक मान है, और बड़े अंकों वाले archives में मान लंबे अंतराल पर होते हैं, यानी कम बारीक। हर archive कितनी देर का है, यह इस पर निर्भर है कि router का तापमान database कब बना था:
| Archive | मेरा router (पुराने OPNsense से बना database) | नया OPNsense 26.x install |
|---|---|---|
/0 |
1 मिनट, 1,000 slots: 16 घंटे 40 मिनट | 1 मिनट, 1,200 slots: 20 घंटे |
/1 |
5 मिनट, 1,000 slots: लगभग 3½ दिन | 5 मिनट, 720 slots: 60 घंटे |
/2 |
1 घंटा, 1,000 slots: लगभग 6 हफ़्ते | 1 घंटा, 1,860 slots: लगभग 11 हफ़्ते |
/3 |
12 घंटे, 3,000 slots: लगभग 4 साल | 1 दिन, 2,284 slots: लगभग 6 साल |
OPNsense upgrade के बाद भी मौजूदा database को बनाए रखता है, इसलिए पुराना router पुराना layout ही रखता है। आख़िरी कॉलम 26.7 के source code से है; मैंने कोई नया install नहीं देखा।
इससे दो बातें निकलती हैं। पिछली रात का per-minute रिकॉर्ड आज सुबह पढ़ें; शाम तक वे मिनट जा चुके होते हैं और सिर्फ़ लंबे अंतराल के औसत बचते हैं। और hourly archive इतना लंबा है कि बिना योजना के भी पहले-और-बाद की तुलना हो जाती है। Fan लगाते समय मेरे archive में एक महीने का “पहले” दर्ज हो चुका था।
गहराई से: archives में क्या रहता है, और hourly आँकड़े spikes क्यों छिपा लेते हैं
API सिर्फ़ औसत देता है। OPNsense की fetchData.py केवल उन round-robin archives को process करती है जिनका consolidation function AVERAGE है, और हर archive का एक “set” बनाती है। Router हर मिनट sensor की एक तात्कालिक reading रखता है; हर hourly मान उन readings का औसत है। 91 °C की एक अकेली reading उसे मुश्किल से हिलाती है।
जिन slots में कोई reading नहीं है, वे ख़ाली मानों के रूप में लौटते हैं। यही script ख़ाली slots को सिर्फ़ series की शुरुआत में हटा देती है। इसलिए जब archive के सबसे पुराने slots ख़ाली हों, जैसे नए database में, तो slots की गिनती archive की लंबाई को कम करके दिखाती है। नीचे का snippet readings और ख़ाली slots अलग-अलग बताता है।
गहराई से: अपने router का सार निकालने के लिए एक console snippet (PC के लिए)
Health ग्राफ़ उतार-चढ़ाव का रूप दिखाता है। यह snippet आँकड़े छापता है: एक archive के लिए औसत, median, 95th percentile और अधिकतम, और कितनी readings 80 °C तक पहुँचीं। यह router के अपने health API को एक read request (एक GET) भेजता है और कुछ नहीं बदलता।
शुरू करने से पहले
- आपको Chrome या Firefox वाला PC चाहिए, और router के web interface का ऐसा login जो Reporting → Health खोल सके।
- आप browser के developer console में, router के अपने पेज पर टाइप करते हैं। कुछ install नहीं करना पड़ता।
- इसमें दो से तीन मिनट लगते हैं।
- यह router या PC पर कुछ नहीं बदलता, इसलिए वापस करने को कुछ नहीं है। काम पूरा होने पर console बंद कर दें।
- नीचे के डिब्बों में Copy पूरे डिब्बे को copy करता है। टूटी रेखाओं वाला डिब्बा वह दिखाता है जो आपको दिखना चाहिए; उसे आप टाइप नहीं करते।
चरण
- Chrome या Firefox में router का web interface खोलें: address bar में वह पता लिखें जिससे आप router का प्रबंधन करते हैं, Enter दबाएँ, और log in करें। आपको OPNsense का dashboard दिखना चाहिए। अगर login पेज न दिखे, तो पता जाँचें और देखें कि PC घर के network पर है। अगर browser चेतावनी दे कि connection private नहीं है, तो ऊपर graph के चरणों के चरण 1 में दिया note देखें।
- किसी भी OPNsense पेज पर रहते हुए browser console खोलें: Windows और Linux पर Chrome में Ctrl+Shift+J या Firefox में Ctrl+Shift+K; Mac पर Cmd+Option+J या Cmd+Option+K। पेज के बगल में या नीचे एक panel खुलता है, जिसमें टाइप करने के लिए एक पंक्ति होती है। अगर वह किसी दूसरे tab पर खुले, तो Console tab पर click करें।
-
नीचे के डिब्बे में Copy दबाएँ। यह पूरा snippet copy कर लेता है।
// Paste into the browser console on any OPNsense page while logged in. // Read-only: one GET to the router's own health API. Changes nothing. (async () => { const LEVEL = 0; // archive: 0 is the finest (one value a minute); higher numbers are coarser. How many exist depends on the router. const url = '/api/diagnostics/systemhealth/get_system_health/cputemp-system/' + LEVEL; let d; try { const r = await fetch(url); if (r.status === 401) { console.log('HTTP 401: not logged in. Log in to the OPNsense web interface in this browser, then paste again.'); return; } if (r.status === 403) { console.log('HTTP 403: logged in, but this user may not read Reporting > Health. Use an account with that privilege.'); return; } if (!r.ok) { console.log('HTTP ' + r.status + ' from ' + url); return; } d = await r.json(); } catch (e) { console.log('No JSON came back (' + e.message + '). Run this on an OPNsense page while logged in.'); return; } const series = d && d.set && d.set.data && d.set.data[0]; if (!series || !Array.isArray(series.values)) { console.log('No temperature series at LEVEL ' + LEVEL + '. A higher LEVEL may not exist on this router; at LEVEL 0, check that Reporting > Health shows a CPU temperature graph.'); return; } const pts = series.values.filter(p => p[1] !== null && !isNaN(p[1])); const empty = series.values.length - pts.length; if (pts.length === 0) { console.log('The series ' + series.key + ' has no readings at this level.'); return; } const v = pts.map(p => p[1]).sort((a, b) => a - b); const n = v.length; const median = n % 2 ? v[(n - 1) / 2] : (v[n / 2 - 1] + v[n / 2]) / 2; const p95 = v[Math.min(n - 1, Math.ceil(0.95 * n) - 1)]; // nearest-rank const when = t => new Date(t).toLocaleString(); // your browser's time zone; each time marks the end of its interval console.log('Series ' + series.key + ', one value every ' + d.set.step_size + ' s'); console.log('From ' + when(pts[0][0]) + ' to ' + when(pts[n - 1][0]) + ': ' + n + ' readings, ' + empty + ' empty slots'); console.log('Average ' + (v.reduce((a, b) => a + b, 0) / n).toFixed(1) + ' °C, median ' + median.toFixed(1) + ', 95th percentile ' + p95.toFixed(1) + ', maximum ' + v[n - 1].toFixed(1)); console.log('Readings at 80 °C or above: ' + v.filter(x => x >= 80).length); })(); -
Console की पंक्ति पर click करें, Ctrl+V (Mac पर Cmd+V) से paste करें और Enter दबाएँ। Browsers console में paste करना रोक सकते हैं, क्योंकि logged-in पेज में किसी अजनबी का code paste करवाना एक जानी-पहचानी चाल है। अनुमति देने से पहले snippet पढ़ लें। अगर browser “allow pasting” टाइप करने को कहे, तो उसके संदेश के अनुसार करें, फिर दोबारा paste करें।
-
एक-दो सेकंड में चार पंक्तियाँ दिखनी चाहिए (“Promise” से शुरू होने वाली पंक्ति को छोड़ दें): series का नाम, readings और ख़ाली slots की संख्या के साथ समय की अवधि, सार के आँकड़े, और 80 °C या उससे ऊपर की readings की गिनती। समय आपके browser के time zone में होते हैं, और हर समय अपने अंतराल का अंत बताता है। 28 अक्टूबर 2026 को मेरे router पर इसने यह छापा (मैंने समय छोड़ दिए हैं; उनका रूप आपके browser की settings पर निर्भर करता है):
Series cpu0temp, one value every 60 s From <start time> to <end time>: 1000 readings, 0 empty slots Average 43.9 °C, median 47.7, 95th percentile 57.8, maximum 72.5 Readings at 80 °C or above: 0 -
“HTTP 401” का मतलब है कि browser OPNsense में logged in नहीं है: log in करें और चरण 4 दोहराएँ। “HTTP 403” का मतलब है कि आप ऐसे user से logged in हैं जिसे Reporting → Health की अनुमति नहीं है।
- Hourly archive पढ़ने के लिए snippet को पहले किसी plain text editor में paste करें (Windows पर Notepad, Mac पर plain text पर सेट TextEdit),
const LEVEL = 0;कोconst LEVEL = 2;करें, वहाँ से पूरा copy करें, और चरण 4 और 5 दोहराएँ। - औसत की तुलना उसी archive के Reporting → Health ग्राफ़ के level से करें। दोनों मेल खाने चाहिए।
- काम पूरा होने पर panel को उसके ऊपर दाईं ओर के × से बंद करें। Router पर कुछ नहीं बदला गया।
फ़ैसला
Case बंद रहेगा और paste अपने डिब्बे में।
जो बचा है वह छोटा है। Fan को अपनी जगह पर पक्का करें, और उसे ऊपर उठाएँ: 10 से 15 mm के rubber feet उसे जगह पर रखेंगे और उसके hub के नीचे के fins तक हवा पहुँचने देंगे, जिन्हें सपाट पड़ा fan हवा से वंचित रखता है। Heatsinks के ऊपर लगे fans के लिए यह आम तरीका है; मैंने इसे यहाँ नापा नहीं। साइड की ग्रिल खुली रखें। पूरा कैबिनेट एक अलग समस्या है: fan router को ठंडा तो करता है, पर सिर्फ़ कैबिनेट की हवा के तापमान के क़रीब तक; और कैबिनेट की हवा कमरे की हवा से गर्म है। उस पर मैंने अलग से काम किया और शायद उस पर लिखूँ।
Fan से पहले यह गर्मी नया router देखने की एक वजह थी। अब नहीं है।
गर्म अलमारी में fanless box रखने वाले से मैं क्या कहूँगा
- पहले वह पढ़ें जो router पहले से दर्ज करता है, कुछ भी खोलने से पहले। OPNsense पर यह Reporting → Health है, या ऊपर वाला API।
- देखें कि आपके router पर हर archive कितनी देर का है। यह इस पर निर्भर है कि उसका database कब बना था।
- कुछ भी बदलने से पहले तय करें कि कौन-सा नतीजा आपको अगले कदम पर भेजेगा।
- अकेली readings पर नहीं, औसत पर फ़ैसला करें। लगातार मिनटों की readings में 30 °C का अंतर हो सकता है।
- पहले सस्ता और वापस लिया जा सकने वाला उपाय आज़माएँ, और उसकी क़ीमत भी तौलें: fan उस box में शोर और धूल लाता है जो इन दोनों से बचने के लिए लिया गया था।
शब्दावली
- Fanless (passive) cooling: case ही heatsink है; गर्मी बिना fan के, चालन और हवा के प्राकृतिक बहाव से निकलती है।
- Thermal paste / repaste: CPU और heatsink के बीच का वह पदार्थ जो सूक्ष्म खाली जगहें भरता है। Repaste का मतलब पुराना पदार्थ साफ़ करके नया लगाना।
- P-core / E-core: एक ही chip में Intel के performance और efficient cores। Pentium Gold 8505 में पहले वाला एक और दूसरे वाले चार हैं।
- TJUNCTION: ख़ुद chip के भीतर Intel द्वारा अनुमत सबसे ऊँचा तापमान। 8505 के लिए यह 100 °C है।
- PWM: pulse-width modulation; एक signal तार जो fan को बताता है कि कितनी तेज़ घूमे।
- Round-robin database (RRD): तय आकार का भंडार, जो हाल का data बारीक रूप में और पुराना data लंबे अंतराल के औसत के रूप में रखता है, और सबसे पुराने को मिटाकर लिखता है।
- Median / 95th percentile: median बीच की reading है (या दो बीच वाली readings का औसत); 95 प्रतिशत readings 95th percentile के बराबर या उससे नीचे होती हैं।
- API: router का programming interface; वही data जो web पेज दिखाते हैं, JSON के रूप में।
- Tunables: kernel settings जिन्हें OPNsense boot के समय लागू करता है; ये System → Settings → Tunables में सूचीबद्ध हैं।
Paste ఇంకా దాని పెట్టెలోనే ఉంది
15 అక్టోబర్ 2026న నా డెస్క్ మీద ఒకే సమస్యకు రెండు పరిష్కారాలు ఉన్నాయి: 4 g ARCTIC MX-7 thermal paste ట్యూబ్ ఒకటి, 120 mm Noctua fan ఒకటి. సమస్య నా router. అది మూసి ఉన్న ప్లైవుడ్ క్యాబినెట్లో OPNsense నడుపుతున్న ఒక fanless mini PC. అంతకు ముందు రోజు దాని CPU 91 °C ను తాకింది.
ఆన్లైన్లో నాకు దొరికిన సలహా కేస్ తెరిచి paste మార్చమని. స్క్రూడ్రైవర్ అవసరం లేదు కాబట్టి నేను ముందు fan పెట్టాను. పెట్టే ముందే, ఏ ఫలితం వస్తే paste దగ్గరకు తిరిగి వెళ్ళాలో నిర్ణయించుకున్నాను.
ఆ అవసరం రాలేదు. Router మొదటి నుంచీ తన ఉష్ణోగ్రతను తానే నమోదు చేసుకుంటూ ఉంది. 16 సెప్టెంబర్ నుంచి 15 అక్టోబర్ సాయంత్రం వరకు, ఏ గంట సగటూ 60 °C కంటే తక్కువ లేదు. Fan పెట్టిన తర్వాతి నాలుగు రోజుల్లో, ఏ గంట సగటూ 49 °C దాటలేదు. Paste ఇంకా దాని పెట్టెలోనే ఉంది.
ఈ పని నేను Anthropic తయారుచేసిన AI మోడల్ Claude తో కలిసి చేశాను. అది నా సొంత బ్రౌజర్ సెషన్ ద్వారా నా router ను చదవగలిగింది. పార్టులు నేను ఎంచుకున్నాను, fan నేను పెట్టాను, నియమం నేను పెట్టాను. Claude ఉష్ణోగ్రత రికార్డులు తీసి లెక్కలు చేసింది. 28 అక్టోబర్న ఈ పోస్ట్ కోసం router గంటవారీ డేటాను మళ్ళీ చదివి చెప్పింది.
బాక్స్, క్యాబినెట్
ఈ router ఆరు పోర్టులు ఉన్న ఒక fanless mini PC. దీన్ని “Shenzhen Weibu” పేరుతో అమ్ముతారు. లోపల Intel Pentium Gold 8505 ఉంది. Intel స్పెసిఫికేషన్ పేజీ ప్రకారం దానిలో ఒక పెర్ఫార్మెన్స్ కోర్, నాలుగు ఎఫిషియెంట్ కోర్లు, ఆరు థ్రెడ్లు ఉన్నాయి; బేస్ పవర్ 15 W, టర్బోలో 55 W వరకు. దీనికి 20 GB RAM, ఆరు Intel I226-V 2.5 GbE పోర్టులు ఉన్నాయి. ఇది OPNsense 26.7 నడుపుతుంది. కేసే heatsink. దాని పైభాగం fins ఉన్న ఒక బ్లాక్.
ఇది ఇతర నెట్వర్క్ పరికరాలతో కలిసి మూసి ఉన్న ఒక ప్లైవుడ్ క్యాబినెట్లో ఉంటుంది. క్యాబినెట్ పక్క ప్యానెల్లోని చీలికల గ్రిల్ ఒక్కటే వేడి గాలి బయటకు పోవడానికి అనుకున్న దారి.
91 °C ప్రమాదకరమా? Intel అంకెల ప్రకారం కాదు. అదే పేజీ చిప్ గరిష్ఠ junction ఉష్ణోగ్రత (TJUNCTION) 100 °C అని చెబుతుంది. ఆ పరిమితికి చేరిన ప్రాసెసర్ పాడవడానికి బదులు తన వేగాన్ని తానే తగ్గించుకుంటుంది. పైగా 91 °C అనేది నమోదైన రీడింగుల్లో అత్యధికం మాత్రమే; router సెన్సార్ను నిమిషానికి ఒకసారి చదువుతుంది, కాబట్టి రెండు రీడింగుల మధ్య వచ్చిన గరిష్ఠాలు నమోదు కాలేదు. అయినా, ఈ వేడి కొత్త router చూడడానికి ఒక కారణంగా మారింది. గంటవారీ సగటు పగలూ రాత్రీ 70 °C దగ్గరే ఉంది, SSD, మెమరీ, నెట్వర్క్ చిప్లు అదే వేడి కేస్లో ఉంటాయి. సాధారణంగా వేడి ఎలక్ట్రానిక్స్ ఆయుష్షును తగ్గిస్తుంది, కానీ ఆ ప్రభావాన్ని గానీ SSD ఉష్ణోగ్రతను గానీ ఈ బాక్స్ మీద నేను కొలవలేదు.
Fan ఎందుకు ముందు
వేడెక్కే mini PC కి repaste అనేది మామూలుగా ఇచ్చే సలహా, అది సహాయపడి ఉండవచ్చు కూడా. కానీ దానికి ఇవి కూడా అవసరమయ్యేవి:
- ముందుగా ఒక కాన్ఫిగరేషన్ బ్యాకప్;
- 99 శాతం ఐసోప్రొపైల్ ఆల్కహాల్, పోగులు వదలని వైప్స్;
- నెట్వర్క్ 45 నుంచి 60 నిమిషాలు ఆఫ్లైన్లో ఉండడం;
- నేను ఎప్పుడూ చూడని స్క్రూలు, thermal pads ఉన్న సీల్ చేసిన కేస్ను తెరవడం.
Fins మీద పడుకోబెట్టిన fan కి అవేవీ అవసరం లేదు, దాన్ని ఒక్క క్షణంలో తీసేయొచ్చు కూడా. దానికీ దాని నష్టాలు ఉన్నాయి. Fanless బాక్స్ దేనికోసమో దాన్నే ఇది వదులుకుంటుంది: శబ్దం లేకపోవడం, దుమ్ము లోపలికి రాకపోవడం, అరిగిపోయే కదిలే భాగం లేకపోవడం.
అందుకే పెట్టే ముందే నియమం పెట్టుకున్నాను: fan ఉన్నా రాత్రి రీడింగులు ఇంకా 80ల్లోకి వెళ్తేనే repaste.
Fan
నేను Noctua NF-F12 5V PWM ఎంచుకున్నాను. Noctua స్పెసిఫికేషన్ ప్రకారం ఇది 120 mm, 5 V, 1,500 rpm వరకు, సాధారణంగా 0.65 W, పూర్తి వేగంలో 22.4 dB(A); బాక్స్లో ఒక USB పవర్ కేబుల్ ఉంటుంది. నా fan router లోని ఒక USB పోర్టుకు కనెక్ట్ అయి ఉంది. USB నుంచి పవర్ ఇస్తే fan కి వేగాన్ని చెప్పే సిగ్నల్ ఏదీ అందదు. సిగ్నల్ లేని PWM fan పూర్తి వేగంతో తిరుగుతుందని Noctua సొంత గైడ్ చెబుతుంది. Noctua దీని మీద “5V PWM version, not for use in PCs” అని గుర్తు పెడుతుంది, అంటే ఇది 5V PWM వెర్షన్, PC లలో వాడడానికి కాదు: PC లోని 12 V fan header దీనికి తగిన సప్లై కాదు.
నా router మీద 120 mm fan పైభాగంలో ఎక్కువ భాగాన్ని కప్పుతుంది. Router పైభాగం పరిమాణానికి దగ్గరగా ఉండే fan ను ఎంచుకోండి. Noctua చిన్న పరిమాణాల్లోనూ 5 V వెర్షన్లు అమ్ముతుంది, ఉదాహరణకు 80 mm NF-A8 5V PWM. చౌకైన 5 V USB fan కూడా గాలిని కదిలిస్తుంది; నేను అలాంటిది ప్రయత్నించలేదు.
15 అక్టోబర్న సుమారు 17:30కి దీన్ని పెట్టాను. ఇది పై fins మీద స్క్రూలు లేకుండా సమతలంగా పడుకుని ఉంది, వాటిలోకి కిందికి గాలి ఊదుతుంది. ఫోటో చూసి చదివినప్పుడు Claude మొదట గాలి దిశను తారుమారుగా చెప్పింది; ఫ్రేమ్లో అచ్చుపోసిన బాణాన్ని నేను చెక్ చేశాను. ఏ దిశ అయినా సహాయపడాలి, కానీ నేను కొలుస్తున్నది ఏ దిశనో తెలుసుకోవాలనుకున్నాను.
Router ఏమి నమోదు చేసింది
OPNsense నిమిషానికి ఒకసారి CPU ఉష్ణోగ్రతను చదువుతుంది, గంటవారీ సగటులను వారాల తరబడి ఉంచుతుంది. మీ router ది ఎలా చదవాలో కింద ఉంది.
Router గంటవారీ archive నుంచి, cpu0 గంటవారీ సగటులు:
| కాలం | గంటలు | సగటు | అతి తక్కువ గంట సగటు | అతి ఎక్కువ గంట సగటు |
|---|---|---|---|---|
| 16 సెప్టెంబర్ – 9 అక్టోబర్ | 567 | 69.7 °C | 65.3 °C | 73.7 °C |
| 11 అక్టోబర్ – 15 అక్టోబర్, fan పెట్టే వరకు | 114 | 66.2 °C | 60.5 °C | 70.9 °C |
| 15 అక్టోబర్, fan పెట్టిన తర్వాత (నాలుగు రోజులు) | 100 | 46.4 °C | 42.6 °C | 48.6 °C |
10 అక్టోబర్ను వదిలేశాను; కింద వివరించిన కాన్ఫిగరేషన్ క్లీన్-అప్ జరిగిన రోజు అది. Fan కి వెంటనే ముందున్న రోజులతో పోలిస్తే, fan సగటు నుంచి సుమారు 20 °C తగ్గించింది. ముందు, తర్వాత పరిధులు ఒకదానితో ఒకటి కలవవు: fan కి ముందు అత్యంత చల్లని గంట, fan తర్వాత అత్యంత వేడి గంట కంటే 12 °C ఎక్కువ వేడిగా ఉంది.
నేను పెట్టిన నియమం రాత్రి రీడింగుల గురించి. 15 అక్టోబర్న నిమిషవారీ రికార్డు నుంచి 03:00–10:00 విండోను చదివాను, 16 అక్టోబర్న అదే విండోను మళ్ళీ చదివాను:
cpu0, 03:00–10:00 |
15 అక్టోబర్, fan లేకుండా | 16 అక్టోబర్, fan తో |
|---|---|---|
| సగటు | 65.6 °C | 46.7 °C |
| గరిష్ఠం | 90.3 °C | 73.6 °C |
| 80 °C లేదా అంతకు పైన ఉన్న రీడింగులు | 19 | 0 |
ఏ రీడింగూ 80ల్లోకి చేరలేదు. నియమం ప్రకారం కేస్ మూసే ఉంచాలి.
నా నియమం ఒక్కొక్క రీడింగును వాడింది, ఒక్కొక్క రీడింగు ఎగుడుదిగుడుగా ఉంటుంది. ప్రతి రీడింగూ ఒక క్షణం విలువ మాత్రమే: 28 అక్టోబర్న వరుస నిమిషాల్లో 35.3, 68.2, 69.0, 35.7 °C వచ్చాయి. కొన్ని గంటల సగటు అయితే మెరుగైన పరీక్ష అయ్యేది. గంటవారీ సగటుల ప్రకారం తేడా ఇంకా ఎక్కువ: fan తర్వాత ఏ గంట సగటూ 48.6 °C దాటలేదు.
లోతైన వివరణ: 15 అక్టోబర్ నిమిషవారీ విండోలు
15 అక్టోబర్న నిమిషవారీ రికార్డు నుంచి చదివినవి.
| విండో, 15 అక్టోబర్ 2026 | రీడింగులు | సగటు | మీడియన్ | 95వ పర్సెంటైల్ | గరిష్ఠం | 80 °C లేదా పైన |
|---|---|---|---|---|---|---|
| 03:00–10:00, fan లేకుండా | 420 | 65.6 °C | 69.0 °C | 79.8 °C | 90.3 °C | 19 |
| 12:00–17:20, fan లేకుండా | 320 | 65.5 °C | 68.7 °C | 80.1 °C | 90.7 °C | 16 |
| 17:31–19:12, fan తో | 101 | 46.0 °C | 48.7 °C | 60.5 °C | 69.6 °C | 0 |
| 19:20–19:37, firmware అప్డేట్, రీబూట్ తర్వాత | 17 | 54.1 °C | 57.1 °C | 70.8 °C | 70.8 °C | 0 |
చివరి వరుస ఎక్కువగా ఉంది, ఎందుకంటే router అప్పుడే firmware update తర్వాత రీబూట్ అయి, ఆ సమయంలో సుమారు 2.7 మిలియన్ blocklist ఎంట్రీలను లోడ్ చేస్తూ ఉంది. అది విశ్రాంతి స్థితిలోని అంకె కాదు.
ఇది ఏమి చూపిస్తుంది, ఏమి చూపించదు
ఇక్కడ fan సరిపోయిందని ఇది చూపిస్తుంది. Repaste కూడా సహాయపడేది కాదని ఇది చూపించదు; నేను repaste ప్రయత్నించలేదు. Fan క్యాబినెట్ నుంచి వేడిని బయటకు తీయదు. అది క్యాబినెట్ గాలిని router fins గుండా బలవంతంగా పంపుతుంది. మూసిన క్యాబినెట్ వల్ల మొదలుపెట్టిన స్థితి మరింత చెడ్డగా ఉండింది, కాబట్టి ఇక్కడ వచ్చిన మెరుగుదల బహిరంగ గాలిలో వచ్చేదానికంటే బహుశా ఎక్కువ.
- గది ఉష్ణోగ్రతను నేను కొలవలేదు. తగ్గుదల ఒక్క గంటలోనే వచ్చింది, ఒక గది ఒక గంటలో 20 °C చల్లబడదు. Router రోజువారీ పగలు-రాత్రి చక్రానికి కూడా కొద్దిగానే స్పందిస్తుంది: 16 సెప్టెంబర్ నుంచి 9 అక్టోబర్ వరకు, రోజులోని ప్రతి గంట సగటు 69.2, 70.3 °C మధ్యే ఉంది, అంటే సుమారు 1 °C హెచ్చుతగ్గు.
- అదే సాయంత్రం firmware మారింది. 15 అక్టోబర్ 19:12కి router firmware అప్డేట్ అయింది. తగ్గుదల ముందే వచ్చింది: fan పెట్టడానికీ అప్డేట్కీ మధ్య ఉన్న 101 నిమిషాల సగటు 46.0 °C.
- ఐదు రోజుల ముందు ఒక కాన్ఫిగరేషన్ క్లీన్-అప్ జరిగింది. 10 అక్టోబర్న నేను ఒక WireGuard VPN క్లయింట్ను, వాడని ఒక ప్రాక్సీ స్టాక్ను (Squid, ClamAV, Redis, వాటితో పాటు ఉండేవి), దానికి ట్రాఫిక్ పంపే NAT రూల్స్ను తీసేశాను; నా DNS blocklists ను కుదించాను; ఒక USB నెట్వర్క్ అడాప్టర్ ప్లగ్ తీసేశాను. గంటవారీ సగటు 16 సెప్టెంబర్ నుంచి 9 అక్టోబర్ వరకు 69.7 °C, 11 అక్టోబర్ నుంచి fan వరకు 66.2 °C. ఆ తగ్గుదల మూడు నాలుగు రోజుల్లో దశలవారీగా వచ్చింది; ఆ మార్పుల ప్రభావాన్ని వాతావరణం ప్రభావం నుంచి నేను వేరు చేయలేను. అందుకే పైన ఉన్న పోలిక fan కి వెంటనే ముందున్న రోజులను మాత్రమే వాడుతుంది.
- పవర్ సెట్టింగులు ఏవీ మారలేదు. Router కాన్ఫిగరేషన్ చరిత్ర 13 అక్టోబర్ నుంచి ఉంది (30 రివిజన్లు). ఆ కాలంలో పవర్ సెట్టింగులు, thermal సెట్టింగులు, tunables లో ఏ మార్పూ అది చూపించదు.
- లోడ్ను నేను నియంత్రించలేదు. ఇవి ఇంటి నెట్వర్క్ మీద మామూలు రోజులు.
- ఇది ఒక క్యాబినెట్లోని ఒక router మాత్రమే.
నేను నిరూపించని ఒక అనుమానం: dashboard
13 అక్టోబర్న, సుమారు 20 గంటల అప్టైమ్ తర్వాత, ప్రాసెస్ వారీగా CPU సమయాన్ని పోల్చాను. DNS రిసాల్వర్ అయిన Unbound 16 సెకన్లు వాడింది, అంటే ఒక కోర్లో సుమారు 0.02 శాతం; ఆ సమయంలో అది నెట్వర్క్లోని పరికరాల నుంచి వచ్చే రోజుకు సుమారు 10,000 అనవసరమైన లుకప్లకు సమాధానం ఇస్తోంది. వెబ్ ఇంటర్ఫేస్ను, API ని నడిపే PHP ప్రాసెస్లు 5 నిమిషాల 9 సెకన్లు వాడాయి, సుమారు 20 రెట్లు ఎక్కువ; అప్పటికే ముగిసిపోయిన PHP workers ను ఆ స్నాప్షాట్ లెక్కలోకి తీసుకోలేదు.
అయినా, 20 గంటల్లో 5 నిమిషాలు అంటే ఒక కోర్లో సుమారు 0.4 శాతం. కొన్ని సెకన్లకు ఒకసారి రిఫ్రెష్ అయ్యే విడ్జెట్లు ఉన్న dashboard తెరిచి ఉండడం ఉష్ణోగ్రతను పెంచి ఉంటే, అది చిన్న బర్స్ట్లలోనే. ఆ వారం నేను చూసిన కొన్ని 78 °C స్పైక్ల వెనుక ఆ బర్స్ట్లు ఉన్నాయని అనుమానించాను. దాన్ని నేను పరీక్షించలేదు.
మీ సొంత router ను చదవడం
OPNsense తన health రికార్డులను Reporting → Health కింద గ్రాఫ్లుగా చూపిస్తుంది. CPU ఉష్ణోగ్రత గ్రాఫ్ను చూడడానికి:
- బ్రౌజర్లో router వెబ్ ఇంటర్ఫేస్ తెరవండి: router ను నిర్వహించడానికి మీరు వాడే చిరునామాను అడ్రస్ బార్లో టైప్ చేసి, Enter నొక్కి, లాగిన్ అవ్వండి. చిరునామా మీకు తెలియకపోతే, router ను సెటప్ చేసిన వారిని అడగండి. router తన సొంత సెక్యూరిటీ సర్టిఫికెట్ను వాడుతుంది, కాబట్టి కనెక్షన్ ప్రైవేట్ కాదని బ్రౌజర్ హెచ్చరించవచ్చు; మీ router చిరునామాకు అది సాధారణమే. Advanced క్లిక్ చేయండి, తర్వాత ఆ చిరునామాకు కొనసాగించే లింక్ను క్లిక్ చేయండి (Chrome లో Proceed, Firefox లో Accept the Risk and Continue).
- మెనూలో Reporting → Health తెరవండి. పేజీ కొన్ని సెకన్లలో లోడ్ అవుతుంది, ఏదీ మార్చదు. అది తన రిపోర్ట్లను అంశాల వారీగా జాబితా చేస్తుంది.
- CPU ఉష్ణోగ్రత రిపోర్ట్ను పేజీలోని రిపోర్ట్ల జాబితాలో కనుగొనండి. అది లేకపోతే, System → Settings → Miscellaneous → Thermal Sensors తెరవండి; నాది “Intel Core CPU on-die thermal sensor (coretemp)” కు సెట్ అయి ఉంది. ఆ సెట్టింగ్ మార్చడం router ను మారుస్తుంది: ముందు పాత విలువను రాసి పెట్టుకోండి, Save* నొక్కండి, router రీడింగులు తీసుకునే వరకు కొన్ని నిమిషాలు వేచి ఉండండి. దాన్ని వెనక్కి తీసుకోవడానికి, పాత విలువను మళ్ళీ ఎంచుకోండి; ఈ సెట్టింగ్ను తిరిగి none కు పెట్టడానికి reboot అవసరం.
అదే డేటా router API నుంచి GET /api/diagnostics/systemhealth/get_system_health/cputemp-system/0 వద్ద వస్తుంది. చివరి అంకె ఒక archive ను ఎంచుకుంటుంది: /0 అంటే నిమిషానికి ఒక విలువ, అంతకంటే పెద్ద అంకెల archives మరింత స్థూలంగా ఉంటాయి. ఒక్కొక్కటి ఎంత కాలం ఉంటుందనేది router ఉష్ణోగ్రత డేటాబేస్ ఎప్పుడు సృష్టించారనే దాని మీద ఆధారపడుతుంది:
| Archive | నా router (పాత OPNsense నుంచి వచ్చిన డేటాబేస్) | కొత్త OPNsense 26.x ఇన్స్టాల్ |
|---|---|---|
/0 |
1 నిమిషం, 1,000 స్లాట్లు: 16 గంటల 40 నిమిషాలు | 1 నిమిషం, 1,200 స్లాట్లు: 20 గంటలు |
/1 |
5 నిమిషాలు, 1,000 స్లాట్లు: సుమారు 3½ రోజులు | 5 నిమిషాలు, 720 స్లాట్లు: 60 గంటలు |
/2 |
1 గంట, 1,000 స్లాట్లు: సుమారు 6 వారాలు | 1 గంట, 1,860 స్లాట్లు: సుమారు 11 వారాలు |
/3 |
12 గంటలు, 3,000 స్లాట్లు: సుమారు 4 సంవత్సరాలు | 1 రోజు, 2,284 స్లాట్లు: సుమారు 6 సంవత్సరాలు |
అప్గ్రేడ్ల సమయంలో OPNsense ఉన్న డేటాబేస్ను అలాగే ఉంచుతుంది, కాబట్టి పాత router పాత అమరికనే కొనసాగిస్తుంది. చివరి కాలమ్ 26.7 సోర్స్ కోడ్ నుంచి తీసుకున్నది; కొత్త ఇన్స్టాల్ను నేను చూడలేదు.
దీని నుంచి రెండు విషయాలు తెలుస్తాయి. నిన్న రాత్రి నిమిషవారీ రికార్డును ఈ ఉదయమే చదవండి; సాయంత్రానికి ఆ నిమిషాలు పోతాయి, స్థూల సగటులు మాత్రమే మిగులుతాయి. ఇంకా, గంటల archive ఎంత పొడవుగా ఉంటుందంటే, మీరు ప్లాన్ చేయని ముందు-తర్వాత పోలికకు కూడా అది సరిపోతుంది. నేను fan పెట్టేనాటికే నా router లో ఒక నెల “ముందు” డేటా ఉంది.
లోతైన వివరణ: archives లో ఏముంటుంది, గంటవారీ అంకెలు స్పైక్లను ఎందుకు దాచేస్తాయి
API సగటులను మాత్రమే ఇస్తుంది. OPNsense లోని fetchData.py consolidation function AVERAGE గా ఉన్న round-robin archives ను మాత్రమే ప్రాసెస్ చేస్తుంది, ప్రతి archive కి ఒక “set” తయారుచేస్తుంది. Router ప్రతి నిమిషం సెన్సార్ నుంచి ఆ క్షణపు రీడింగ్ ఒకటి నిల్వ చేస్తుంది; ప్రతి గంటవారీ విలువ ఆ రీడింగుల సగటు. 91 °C అనే ఒక్క రీడింగ్ దాన్ని దాదాపు కదిలించదు.
రీడింగ్ లేని స్లాట్లు ఖాళీ విలువలుగా వస్తాయి. అదే స్క్రిప్ట్ ఖాళీ స్లాట్లను ఒక సిరీస్ మొదట్లో మాత్రమే తొలగిస్తుంది. కాబట్టి archive లోని అన్నిటికంటే పాత స్లాట్లు ఖాళీగా ఉన్నప్పుడు, అంటే కొత్త డేటాబేస్లో, స్లాట్ల లెక్క archive పొడవును తక్కువగా చూపిస్తుంది. కింది snippet రీడింగులను, ఖాళీ స్లాట్లను వేరువేరుగా చూపిస్తుంది.
లోతైన వివరణ: మీ router సారాంశం చూపించే ఒక console snippet (PC కోసం)
Health గ్రాఫ్ ఆకారాన్ని చూపిస్తుంది. ఇది అంకెలను ప్రింట్ చేస్తుంది: ఒక archive కి సగటు, మీడియన్, 95వ పర్సెంటైల్, గరిష్ఠం, 80 °C కి చేరిన రీడింగులు ఎన్ని. ఇది router సొంత health API కి ఒక చదివే అభ్యర్థనను (ఒక GET) పంపుతుంది, ఏమీ మార్చదు.
ప్రారంభించే ముందు
- మీకు Chrome లేదా Firefox ఉన్న ఒక PC, Reporting → Health తెరవగల router వెబ్ ఇంటర్ఫేస్ లాగిన్ కావాలి.
- మీరు బ్రౌజర్ డెవలపర్ console లో, router సొంత పేజీలో టైప్ చేస్తారు. ఏదీ ఇన్స్టాల్ చేయరు.
- దీనికి రెండు మూడు నిమిషాలు పడుతుంది.
- ఇది router లో గానీ PC లో గానీ ఏమీ మార్చదు, కాబట్టి వెనక్కి తీసుకోవాల్సింది ఏమీ లేదు. పూర్తయ్యాక console ను మూసివేయండి.
- కింది పెట్టెల్లో Copy పెట్టె మొత్తాన్ని కాపీ చేస్తుంది. గీతల అంచు ఉన్న పెట్టె మీకు కనిపించవలసినది చూపిస్తుంది; దాన్ని మీరు టైప్ చేయరు.
దశలు
- Chrome లేదా Firefox లో router వెబ్ ఇంటర్ఫేస్ తెరవండి: router ను నిర్వహించడానికి మీరు వాడే చిరునామాను అడ్రస్ బార్లో టైప్ చేసి, Enter నొక్కి, లాగిన్ అవ్వండి. మీకు OPNsense dashboard కనిపించాలి. లాగిన్ పేజీ రాకపోతే, చిరునామాను, PC హోమ్ నెట్వర్క్లో ఉందో లేదో చూడండి. బ్రౌజర్ కనెక్షన్ ప్రైవేట్ కాదని హెచ్చరిస్తే, పైన గ్రాఫ్ దశల్లోని 1వ దశలోని గమనికను చూడండి.
- ఏదైనా OPNsense పేజీలోనే ఉండి బ్రౌజర్ console తెరవండి: Windows, Linux లో Chrome అయితే Ctrl+Shift+J, Firefox అయితే Ctrl+Shift+K; Mac లో Cmd+Option+J లేదా Cmd+Option+K. పేజీ పక్కన లేదా కింద ఒక ప్యానెల్ తెరుచుకుంటుంది, టైప్ చేయడానికి ఒక లైన్తో. అది వేరే ట్యాబ్లో తెరుచుకుంటే, Console ట్యాబ్ను క్లిక్ చేయండి.
-
కింది పెట్టెలో Copy క్లిక్ చేయండి. అది snippet మొత్తాన్ని కాపీ చేస్తుంది.
// Paste into the browser console on any OPNsense page while logged in. // Read-only: one GET to the router's own health API. Changes nothing. (async () => { const LEVEL = 0; // archive: 0 is the finest (one value a minute); higher numbers are coarser. How many exist depends on the router. const url = '/api/diagnostics/systemhealth/get_system_health/cputemp-system/' + LEVEL; let d; try { const r = await fetch(url); if (r.status === 401) { console.log('HTTP 401: not logged in. Log in to the OPNsense web interface in this browser, then paste again.'); return; } if (r.status === 403) { console.log('HTTP 403: logged in, but this user may not read Reporting > Health. Use an account with that privilege.'); return; } if (!r.ok) { console.log('HTTP ' + r.status + ' from ' + url); return; } d = await r.json(); } catch (e) { console.log('No JSON came back (' + e.message + '). Run this on an OPNsense page while logged in.'); return; } const series = d && d.set && d.set.data && d.set.data[0]; if (!series || !Array.isArray(series.values)) { console.log('No temperature series at LEVEL ' + LEVEL + '. A higher LEVEL may not exist on this router; at LEVEL 0, check that Reporting > Health shows a CPU temperature graph.'); return; } const pts = series.values.filter(p => p[1] !== null && !isNaN(p[1])); const empty = series.values.length - pts.length; if (pts.length === 0) { console.log('The series ' + series.key + ' has no readings at this level.'); return; } const v = pts.map(p => p[1]).sort((a, b) => a - b); const n = v.length; const median = n % 2 ? v[(n - 1) / 2] : (v[n / 2 - 1] + v[n / 2]) / 2; const p95 = v[Math.min(n - 1, Math.ceil(0.95 * n) - 1)]; // nearest-rank const when = t => new Date(t).toLocaleString(); // your browser's time zone; each time marks the end of its interval console.log('Series ' + series.key + ', one value every ' + d.set.step_size + ' s'); console.log('From ' + when(pts[0][0]) + ' to ' + when(pts[n - 1][0]) + ': ' + n + ' readings, ' + empty + ' empty slots'); console.log('Average ' + (v.reduce((a, b) => a + b, 0) / n).toFixed(1) + ' °C, median ' + median.toFixed(1) + ', 95th percentile ' + p95.toFixed(1) + ', maximum ' + v[n - 1].toFixed(1)); console.log('Readings at 80 °C or above: ' + v.filter(x => x >= 80).length); })(); -
console లోని లైన్ను క్లిక్ చేసి, Ctrl+V తో (Mac లో Cmd+V) పేస్ట్ చేసి Enter నొక్కండి. బ్రౌజర్లు console లో పేస్ట్ చేయడాన్ని ఆపవచ్చు, ఎందుకంటే లాగిన్ అయిన పేజీలో తెలియని వ్యక్తి కోడ్ను పేస్ట్ చేయించడం ఒక తెలిసిన మోసం. అనుమతించే ముందు snippet ను చదవండి. బ్రౌజర్ “allow pasting” అని టైప్ చేయమని అడిగితే, దాని సందేశం చెప్పినట్టు చేసి, మళ్ళీ పేస్ట్ చేయండి.
-
ఒకటి రెండు సెకన్లలో మీకు నాలుగు లైన్లు కనిపించాలి (“Promise” తో మొదలయ్యే లైన్ను పట్టించుకోకండి): సిరీస్ పేరు, రీడింగులు ఎన్ని, ఖాళీ స్లాట్లు ఎన్ని అనే వివరాలతో సమయ పరిధి, సారాంశ అంకెలు, 80 °C లేదా అంతకంటే ఎక్కువ ఉన్న రీడింగుల లెక్క. సమయాలు మీ బ్రౌజర్ టైమ్ జోన్లో ఉంటాయి; ప్రతి సమయం దాని వ్యవధి ముగిసిన క్షణాన్ని సూచిస్తుంది. నా router లో, 28 అక్టోబర్ 2026న, ఇది ఇలా ప్రింట్ చేసింది (సమయాలను నేను వదిలేశాను; వాటి ఫార్మాట్ మీ బ్రౌజర్ సెట్టింగ్లను బట్టి ఉంటుంది):
Series cpu0temp, one value every 60 s From <start time> to <end time>: 1000 readings, 0 empty slots Average 43.9 °C, median 47.7, 95th percentile 57.8, maximum 72.5 Readings at 80 °C or above: 0 -
“HTTP 401” అంటే బ్రౌజర్ OPNsense లో లాగిన్ అయి లేదు: లాగిన్ అయి 4వ దశను మళ్ళీ చేయండి. “HTTP 403” అంటే Reporting → Health చూసే అనుమతి లేని యూజర్గా మీరు లాగిన్ అయ్యారు.
- గంటవారీ archive చదవడానికి, snippet ను ముందు ఒక సాధారణ టెక్స్ట్ ఎడిటర్లో పేస్ట్ చేయండి (Windows లో Notepad, Mac లో plain text కు సెట్ చేసిన TextEdit),
const LEVEL = 0;నుconst LEVEL = 2;కు మార్చండి, అక్కడి నుంచి మొత్తాన్ని కాపీ చేసి, 4, 5 దశలను మళ్ళీ చేయండి. - ఆ సగటును అదే archive కు సంబంధించిన Reporting → Health గ్రాఫ్ స్థాయితో పోల్చండి. రెండూ సరిపోలాలి.
- పూర్తయ్యాక, ప్యానెల్ను దాని కుడి పైన ఉన్న × తో మూసివేయండి. router లో ఏదీ మార్చబడలేదు.
తీర్పు
కేస్ మూసే ఉంటుంది, paste దాని పెట్టెలోనే ఉంటుంది.
మిగిలింది చిన్న పని. Fan ను బిగించండి, పైకి లేపండి: 10 నుంచి 15 mm రబ్బర్ కాళ్ళు దాన్ని స్థానంలో పట్టి ఉంచగలవు, దాని hub కింద ఉన్న fins కు గాలి చేరనివ్వగలవు; సమతలంగా పడుకున్న fan ఆ fins కు గాలి సరిగా అందనివ్వదు. Heatsinks మీద పెట్టే fans కు ఇది సాధారణ పద్ధతి; ఇక్కడ నేను దీన్ని కొలవలేదు. పక్క గ్రిల్కు అడ్డు లేకుండా చూడండి. క్యాబినెట్ మొత్తం వేరే సమస్య: fan router ను క్యాబినెట్ గాలి ఉష్ణోగ్రతకు దగ్గరగా మాత్రమే చల్లబరచగలదు, ఆ గాలి గది కంటే వేడిగా ఉంటుంది. దాన్ని నేను వేరుగా పరిశీలించాను, దాని గురించి తర్వాత రాస్తానేమో.
Fan కి ముందు, ఈ వేడి కొత్త router చూడడానికి ఒక కారణంగా ఉండేది. ఇప్పుడు కాదు.
వేడి అల్మరాలో fanless బాక్స్ ఉన్నవారికి నేను చెప్పేది
- Router ఇప్పటికే ఏమి నమోదు చేస్తుందో చదవండి, ఏదైనా తెరిచే ముందు. OPNsense లో అది Reporting → Health, లేదా పైన చెప్పిన API.
- మీ router లో ప్రతి archive ఎంత కాలం ఉంటుందో చెక్ చేసుకోండి. అది దాని డేటాబేస్ ఎప్పుడు సృష్టించారనే దాని మీద ఆధారపడుతుంది.
- ఏ ఫలితం వస్తే తర్వాతి దశకు వెళ్ళాలో నిర్ణయించుకోండి, ఏదైనా మార్చే ముందే.
- ఒక్కొక్క రీడింగును కాదు, సగటులను బట్టి తేల్చండి. వరుస నిమిషాల రీడింగుల మధ్య 30 °C తేడా ఉండవచ్చు.
- చౌకైన, వెనక్కి తీసుకోగల పరిష్కారాన్ని ముందు ప్రయత్నించండి, దాని నష్టాన్నీ బేరీజు వేయండి: శబ్దం, దుమ్ము లేకుండా ఉండాలని కొన్న బాక్స్కు fan ఆ రెండింటినీ తెస్తుంది.
పదకోశం
- Fanless (passive) cooling: కేసే heatsink; fan లేకుండా, ఉష్ణ వహనం, సహజ గాలి ప్రవాహం ద్వారా వేడి బయటకు పోతుంది.
- Thermal paste / repaste: CPU కీ heatsink కీ మధ్య ఉండి, సూక్ష్మమైన ఖాళీలను నింపే పదార్థం. Repaste అంటే పాత పదార్థాన్ని శుభ్రంగా తుడిచి కొత్తది పూయడం.
- P-core / E-core: ఒకే చిప్లో ఉండే Intel పెర్ఫార్మెన్స్ కోర్లు, ఎఫిషియెంట్ కోర్లు. Pentium Gold 8505 లో మొదటి రకం ఒకటి, రెండో రకం నాలుగు ఉన్నాయి.
- TJUNCTION: చిప్లోనే Intel అనుమతించే అత్యధిక ఉష్ణోగ్రత. 8505 కి అది 100 °C.
- PWM: pulse-width modulation; fan ఎంత వేగంగా తిరగాలో చెప్పే ఒక సిగ్నల్ వైర్.
- Round-robin database (RRD): స్థిర పరిమాణం ఉన్న ఒక నిల్వ. ఇటీవలి డేటాను సూక్ష్మ వివరంగా, పాత డేటాను స్థూల సగటులుగా ఉంచుతుంది, అన్నిటికంటే పాత డేటాను తుడిచి దాని మీద రాస్తుంది.
- మీడియన్ / 95వ పర్సెంటైల్: మీడియన్ అంటే మధ్యలో ఉండే రీడింగ్ (లేదా మధ్యలో ఉండే రెండు రీడింగుల సగటు); 95 శాతం రీడింగులు 95వ పర్సెంటైల్ వద్ద గానీ దాని కంటే కింద గానీ ఉంటాయి.
- API: router ప్రోగ్రామింగ్ ఇంటర్ఫేస్; వెబ్ పేజీలు చూపించే డేటానే JSON గా ఇస్తుంది.
- Tunables: OPNsense బూట్ సమయంలో వర్తింపజేసే kernel సెట్టింగులు; ఇవి System → Settings → Tunables కింద కనిపిస్తాయి.
Thermal paste ยังอยู่ในกล่อง
เมื่อวันที่ 15 ตุลาคม 2026 ผมมีทางแก้สองทางสำหรับปัญหาเดียววางอยู่บนโต๊ะ: thermal paste ARCTIC MX-7 หนึ่งหลอดขนาด 4 g และ fan Noctua ขนาด 120 mm ปัญหาคือ router ของผม ซึ่งเป็น mini PC แบบ fanless ที่รัน OPNsense อยู่ในตู้ไม้อัดแบบปิด วันก่อนหน้านั้น CPU ของมันขึ้นไปแตะ 91 °C
คำแนะนำที่ผมเจอในอินเทอร์เน็ตคือให้เปิดเคสแล้วเปลี่ยน paste ใหม่ ผมติด fan ก่อน เพราะไม่ต้องใช้ไขควง ก่อนติด ผมตัดสินใจไว้ว่าผลแบบไหนจะทำให้ผมต้องกลับไปใช้ paste
ผมไม่เคยต้องใช้มัน router บันทึกอุณหภูมิของตัวเองไว้ตลอดอยู่แล้ว ระหว่างวันที่ 16 กันยายนถึงช่วงเย็นของวันที่ 15 ตุลาคม ไม่มีชั่วโมงไหนที่ค่าเฉลี่ยต่ำกว่า 60 °C ในสี่วันหลังติด fan ไม่มีชั่วโมงไหนที่ค่าเฉลี่ยสูงกว่า 49 °C ตอนนี้ paste ยังอยู่ในกล่อง
ผมทำงานนี้ร่วมกับ Claude ซึ่งเป็นโมเดล AI ของ Anthropic โดย Claude อ่านข้อมูลจาก router ผ่าน browser session ของผมเองได้ ผมเป็นคนเลือกชิ้นส่วน ติด fan และตั้งเกณฑ์ Claude ดึงบันทึกอุณหภูมิและคำนวณตัวเลข และเมื่อวันที่ 28 ตุลาคม ก็ดึงข้อมูลรายชั่วโมงของ router มาอีกครั้งสำหรับโพสต์นี้
ตัวเครื่องและตู้
router ตัวนี้เป็น mini PC แบบ fanless หกพอร์ต ขายภายใต้ชื่อ “Shenzhen Weibu” ข้างในเป็น Intel Pentium Gold 8505: performance core หนึ่งคอร์และ efficient core สี่คอร์ หก thread กำลังไฟพื้นฐาน 15 W และสูงสุด 55 W ในโหมด turbo ตามหน้าสเปกของ Intel มี RAM 20 GB และพอร์ต Intel I226-V 2.5 GbE หกพอร์ต รัน OPNsense 26.7 ตัวเคสคือ heatsink ด้านบนทั้งแผ่นเป็น fins
มันอยู่ในตู้ไม้อัดแบบปิดร่วมกับอุปกรณ์เครือข่ายอื่น ตะแกรงแบบช่องบนแผงข้างตู้เป็นทางระบายลมร้อนทางเดียวที่ตั้งใจทำไว้
91 °C อันตรายไหม? ตามตัวเลขของ Intel ไม่อันตราย หน้าเดียวกันระบุอุณหภูมิ junction สูงสุดของชิป (TJUNCTION) ไว้ที่ 100 °C และโปรเซสเซอร์ที่แตะขีดนั้นจะลดความเร็วตัวเองลง ไม่ใช่พัง อีกอย่าง 91 °C เป็นแค่ค่าสูงสุดในบรรดาค่าที่อ่านตามรอบ router อ่าน sensor นาทีละครั้ง ค่าที่พุ่งขึ้นระหว่างนั้นจึงไม่ถูกบันทึก ถึงอย่างนั้น ความร้อนก็กลายเป็นเหตุผลให้ผมมองหา router ตัวใหม่ ค่าเฉลี่ยรายชั่วโมงอยู่ราว 70 °C ทั้งกลางวันและกลางคืน และ SSD หน่วยความจำ และชิปเครือข่าย อยู่ในเคสร้อนอันเดียวกัน โดยทั่วไปความร้อนทำให้อุปกรณ์อิเล็กทรอนิกส์อายุสั้นลง แต่ผมไม่ได้วัดทั้งเรื่องนั้นและอุณหภูมิของ SSD บนเครื่องนี้
ทำไมเลือก fan ก่อน
การ repaste เป็นคำแนะนำปกติสำหรับ mini PC ที่ร้อน และก็อาจช่วยได้จริง แต่ถ้าทำ ก็จะต้อง:
- สำรอง configuration ไว้ก่อน
- แอลกอฮอล์ไอโซโพรพิล 99 เปอร์เซ็นต์ และผ้าเช็ดที่ไม่ทิ้งขุย
- 45 ถึง 60 นาทีที่เครือข่ายออฟไลน์
- เปิดเคสที่ปิดผนึกไว้ ซึ่งผมไม่เคยเห็นสกรูและ thermal pad ข้างในมาก่อน
fan ที่วางบน fins ไม่ต้องใช้อะไรในรายการนั้นเลย และถอดออกได้ในวินาทีเดียว แต่มันก็มีต้นทุนของมันเอง มันทำให้เสียสิ่งที่เป็นเหตุผลของการมีเครื่อง fanless ไป: ไม่มีเสียง ไม่ดูดฝุ่นเข้า ไม่มีชิ้นส่วนเคลื่อนไหวที่สึกหรอ
ผมจึงตั้งเกณฑ์ไว้ก่อนติด: จะ repaste ก็ต่อเมื่อค่าที่อ่านได้ช่วงกลางคืนยังขึ้นไปถึงระดับ 80 กว่า °C ทั้งที่ติด fan แล้ว
ตัว fan
ผมเลือก Noctua NF-F12 5V PWM สเปก ของ Noctua ระบุขนาด 120 mm ไฟ 5 V ความเร็วสูงสุด 1,500 rpm กินไฟปกติ 0.65 W และดัง 22.4 dB(A) ที่ความเร็วสูงสุด มีสาย USB สำหรับจ่ายไฟมาในกล่อง ตัวของผมเสียบอยู่กับพอร์ต USB ช่องหนึ่งของ router เอง เมื่อจ่ายไฟจาก USB fan จะไม่ได้รับสัญญาณความเร็ว และคู่มือของ Noctua เอง บอกว่า fan แบบ PWM ที่ไม่มีสัญญาณจะหมุนที่ความเร็วสูงสุด Noctua ระบุว่ารุ่นนี้เป็น “5V PWM version, not for use in PCs” ซึ่งหมายความว่า เป็นรุ่น 5V PWM ไม่ได้มีไว้ใช้กับ PC: fan header 12 V ของ PC เป็นแหล่งจ่ายไฟที่ผิดสำหรับมัน
บน router ของผม fan ขนาด 120 mm คลุมด้านบนส่วนใหญ่ เลือก fan ที่มีขนาดใกล้เคียงกับด้านบนของ router Noctua ยังขายรุ่น 5 V ขนาดเล็กกว่านี้ด้วย เช่น NF-A8 5V PWM ขนาด 80 mm fan USB 5 V ที่ราคาถูกกว่าก็น่าจะเป่าลมได้เช่นกัน แต่ผมยังไม่เคยลอง
ผมติดตั้งมันราว 17:30 ของวันที่ 15 ตุลาคม มันวางราบอยู่บน fins ด้านบน ไม่ได้ขันสกรูยึด และเป่าลมลงไปใน fins ตอนอ่านจากรูปถ่าย Claude เข้าใจทิศทางลมกลับด้านในตอนแรก ผมจึงดูลูกศรที่ขึ้นรูปไว้บนกรอบ แบบไหนก็น่าจะช่วยได้ แต่ผมอยากรู้ว่ากำลังวัดแบบไหนอยู่
สิ่งที่ router บันทึกไว้
OPNsense อ่านอุณหภูมิ CPU นาทีละครั้ง และเก็บค่าเฉลี่ยรายชั่วโมงไว้หลายสัปดาห์ วิธีอ่านข้อมูลของ router คุณเองอยู่ด้านล่าง
ค่าเฉลี่ยรายชั่วโมงของ cpu0 จาก archive รายชั่วโมงของ router:
| ช่วงเวลา | จำนวนชั่วโมง | ค่าเฉลี่ย | ชั่วโมงที่ต่ำสุด | ชั่วโมงที่สูงสุด |
|---|---|---|---|---|
| 16 กันยายน – 9 ตุลาคม | 567 | 69.7 °C | 65.3 °C | 73.7 °C |
| 11 ตุลาคม – 15 ตุลาคม ก่อนติด fan | 114 | 66.2 °C | 60.5 °C | 70.9 °C |
| 15 ตุลาคม หลังติด fan (สี่วัน) | 100 | 46.4 °C | 42.6 °C | 48.6 °C |
ผมไม่นับวันที่ 10 ตุลาคม ซึ่งเป็นวันเก็บกวาด configuration ที่เล่าไว้ด้านล่าง เมื่อเทียบกับไม่กี่วันก่อนติด fan ตัว fan ลดค่าเฉลี่ยลงราว 20 °C ช่วงค่าก่อนและหลังไม่ซ้อนทับกัน: ชั่วโมงที่เย็นที่สุดก่อนติด fan ยังร้อนกว่าชั่วโมงที่ร้อนที่สุดหลังติด fan อยู่ 12 °C
เกณฑ์ที่ผมตั้งไว้ดูจากค่าที่อ่านได้ช่วงกลางคืน วันที่ 15 ตุลาคม ผมอ่านช่วง 03:00–10:00 จากข้อมูลรายนาที และวันที่ 16 ตุลาคม ผมอ่านช่วงเดียวกันอีกครั้ง:
cpu0, 03:00–10:00 |
15 ตุลาคม ไม่มี fan | 16 ตุลาคม มี fan |
|---|---|---|
| ค่าเฉลี่ย | 65.6 °C | 46.7 °C |
| ค่าสูงสุด | 90.3 °C | 73.6 °C |
| จำนวนค่าที่ 80 °C ขึ้นไป | 19 | 0 |
ไม่มีค่าไหนขึ้นไปถึงระดับ 80 กว่า เกณฑ์บอกว่าให้ปิดเคสไว้ตามเดิม
เกณฑ์ของผมใช้ค่าเดี่ยว และค่าเดี่ยวกระโดดไปมา แต่ละค่าคือค่า ณ ขณะเดียว: วันที่ 28 ตุลาคม นาทีที่ต่อกันอ่านได้ 35.3, 68.2, 69.0 และ 35.7 °C ถ้าใช้ค่าเฉลี่ยหลายชั่วโมงจะเป็นการทดสอบที่ดีกว่า เมื่อดูจากค่าเฉลี่ยรายชั่วโมง ความต่างยิ่งมากขึ้นอีก: หลังติด fan ไม่มีชั่วโมงไหนสูงกว่า 48.6 °C
เจาะลึก: ช่วงเวลารายนาทีของวันที่ 15 ตุลาคม
อ่านจากข้อมูลรายนาทีเมื่อวันที่ 15 ตุลาคม
| ช่วงเวลา วันที่ 15 ตุลาคม 2026 | จำนวนค่า | ค่าเฉลี่ย | ค่ามัธยฐาน | เปอร์เซ็นไทล์ที่ 95 | ค่าสูงสุด | จำนวนค่าที่ 80 °C ขึ้นไป |
|---|---|---|---|---|---|---|
| 03:00–10:00 ไม่มี fan | 420 | 65.6 °C | 69.0 °C | 79.8 °C | 90.3 °C | 19 |
| 12:00–17:20 ไม่มี fan | 320 | 65.5 °C | 68.7 °C | 80.1 °C | 90.7 °C | 16 |
| 17:31–19:12 มี fan | 101 | 46.0 °C | 48.7 °C | 60.5 °C | 69.6 °C | 0 |
| 19:20–19:37 หลังอัปเดต firmware และ reboot | 17 | 54.1 °C | 57.1 °C | 70.8 °C | 70.8 °C | 0 |
แถวสุดท้ายสูงกว่าเพราะ router เพิ่ง reboot หลังอัปเดต firmware และกำลังโหลดรายการ blocklist ราว 2.7 ล้านรายการ ไม่ใช่ตัวเลขตอนที่เครื่องอยู่ตัวแล้ว
สิ่งที่ผลนี้แสดง และไม่ได้แสดง
ผลนี้แสดงว่า fan เพียงพอสำหรับกรณีนี้ แต่ไม่ได้แสดงว่าการ repaste จะไม่ช่วยด้วย เพราะผมไม่เคยลอง fan ไม่ได้นำความร้อนออกจากตู้ มันบังคับให้อากาศในตู้ไหลผ่าน fins ของ router ตู้ที่ปิดทำให้จุดเริ่มต้นแย่กว่าปกติ ผลที่ได้ตรงนี้จึงน่าจะมากกว่าตอนที่ router ตั้งอยู่ในที่โล่ง
- ผมไม่ได้วัดอุณหภูมิห้อง อุณหภูมิลดลงภายในหนึ่งชั่วโมง และห้องไม่เย็นลง 20 °C ในชั่วโมงเดียว นอกจากนี้ router ยังตอบสนองต่อรอบกลางวันกลางคืนเพียงเล็กน้อย: ตั้งแต่ 16 กันยายนถึง 9 ตุลาคม ค่าเฉลี่ยของแต่ละชั่วโมงในรอบวันอยู่ระหว่าง 69.2 ถึง 70.3 °C ต่างกันราว 1 °C
- firmware เปลี่ยนในเย็นวันเดียวกัน router อัปเดต firmware เวลา 19:12 ของวันที่ 15 ตุลาคม อุณหภูมิลดลงก่อน: 101 นาทีระหว่างติด fan กับการอัปเดตมีค่าเฉลี่ย 46.0 °C
- มีการเก็บกวาด configuration ห้าวันก่อนหน้านั้น วันที่ 10 ตุลาคม ผมลบ WireGuard VPN client, proxy stack ที่ไม่ได้ใช้ (Squid, ClamAV, Redis และส่วนประกอบที่มาด้วยกัน) และ NAT rule ที่ส่งทราฟฟิกเข้าไปหามัน ลดขนาด DNS blocklist และถอด USB network adapter ออก ค่าเฉลี่ยรายชั่วโมงอยู่ที่ 69.7 °C ตั้งแต่ 16 กันยายนถึง 9 ตุลาคม และ 66.2 °C ตั้งแต่ 11 ตุลาคมจนถึงตอนติด fan การลดลงนั้นเกิดเป็นขั้นๆ ในสามถึงสี่วัน และผมแยกผลของการเปลี่ยนแปลงเหล่านั้นออกจากผลของสภาพอากาศไม่ได้ นี่คือเหตุผลที่การเปรียบเทียบด้านบนใช้เฉพาะไม่กี่วันก่อนติด fan
- การตั้งค่าพลังงานไม่ได้เปลี่ยน ประวัติ configuration ของ router ย้อนไปถึงวันที่ 13 ตุลาคม (30 revision) และไม่มีการเปลี่ยนการตั้งค่าพลังงาน การตั้งค่าความร้อน หรือ tunables ในช่วงนั้น
- ผมไม่ได้ควบคุมโหลด นี่คือวันปกติของเครือข่ายในบ้าน
- นี่คือ router ตัวเดียวในตู้ใบเดียว
ข้อสันนิษฐานที่ผมไม่ได้พิสูจน์: dashboard
วันที่ 13 ตุลาคม ตอน uptime ราว 20 ชั่วโมง ผมเปรียบเทียบ CPU time ของแต่ละ process Unbound ซึ่งเป็น DNS resolver ใช้ไป 16 วินาที ราว 0.02 เปอร์เซ็นต์ของหนึ่งคอร์ ระหว่างที่ตอบ lookup ที่ไม่ต้องการราว 10,000 ครั้งต่อวันจากอุปกรณ์ในเครือข่าย ส่วน process ของ PHP ที่ให้บริการ web interface และ API ใช้ไป 5 นาที 9 วินาที ซึ่งเป็นราว 20 เท่าของ Unbound และ snapshot นั้นไม่ได้นับ PHP worker ที่จบการทำงานไปแล้ว
ถึงอย่างนั้น 5 นาทีใน 20 ชั่วโมงก็เป็นราว 0.4 เปอร์เซ็นต์ของหนึ่งคอร์ ถ้า dashboard ที่เปิดค้างไว้ ซึ่ง widget ของมันรีเฟรชทุกไม่กี่วินาที ทำให้อุณหภูมิสูงขึ้น ก็เกิดเป็นช่วงสั้นๆ ที่โหลดพุ่ง ผมสงสัยว่าช่วงโหลดพุ่งเหล่านั้นอยู่เบื้องหลังค่าพุ่ง 78 °C บางครั้งที่ผมเห็นในสัปดาห์นั้น ผมไม่ได้ทดสอบ
อ่านข้อมูลจาก router ของคุณเอง
OPNsense แสดงบันทึกสถานะของระบบเป็นกราฟที่ Reporting → Health วิธีดูกราฟอุณหภูมิ CPU:
- เปิด web interface ของ router ใน browser: พิมพ์ที่อยู่ที่คุณใช้จัดการ router ลงในแถบที่อยู่ กด Enter แล้ว log in ถ้าคุณไม่ทราบที่อยู่ ให้ถามคนที่ตั้งค่า router ให้คุณ ตัว router ใช้ใบรับรองความปลอดภัยของตัวเอง browser จึงอาจเตือนว่าการเชื่อมต่อไม่เป็นส่วนตัว สำหรับที่อยู่ของ router ของคุณเอง นั่นเป็นเรื่องที่คาดไว้ได้ คลิก Advanced แล้วคลิกลิงก์ที่ไปต่อยังที่อยู่นั้น (Proceed ใน Chrome, Accept the Risk and Continue ใน Firefox)
- ในเมนู เปิด Reporting → Health หน้านี้โหลดภายในไม่กี่วินาทีและไม่เปลี่ยนแปลงอะไร หน้านี้แสดงรายการ report แยกตามหัวข้อ
- หา report อุณหภูมิ CPU ในรายการ report ของหน้านั้น ถ้าไม่มี ให้เปิด System → Settings → Miscellaneous → Thermal Sensors ของผมตั้งไว้เป็น “Intel Core CPU on-die thermal sensor (coretemp)” การเปลี่ยนค่านี้เป็นการเปลี่ยน router: จดค่าเดิมไว้ก่อน กด Save* แล้วรอไม่กี่นาทีระหว่างที่ router อ่านค่า ถ้าจะยกเลิก ให้เลือกค่าเดิมอีกครั้ง ถ้าตั้งกลับเป็น none ต้อง reboot
ข้อมูลชุดเดียวกันดึงได้จาก API ของ router ที่ GET /api/diagnostics/systemhealth/get_system_health/cputemp-system/0 ตัวเลขท้ายสุดใช้เลือก archive: /0 คือค่าหนึ่งค่าต่อนาที และตัวเลขที่สูงขึ้นจะหยาบขึ้น แต่ละ archive เก็บได้นานแค่ไหนขึ้นกับว่าฐานข้อมูลอุณหภูมิของ router ถูกสร้างเมื่อไร:
| Archive | router ของผม (ฐานข้อมูลจาก OPNsense รุ่นเก่า) | OPNsense 26.x ที่ติดตั้งใหม่ |
|---|---|---|
/0 |
1 นาที, 1,000 ช่อง: 16 ชั่วโมง 40 นาที | 1 นาที, 1,200 ช่อง: 20 ชั่วโมง |
/1 |
5 นาที, 1,000 ช่อง: ราว 3½ วัน | 5 นาที, 720 ช่อง: 60 ชั่วโมง |
/2 |
1 ชั่วโมง, 1,000 ช่อง: ราว 6 สัปดาห์ | 1 ชั่วโมง, 1,860 ช่อง: ราว 11 สัปดาห์ |
/3 |
12 ชั่วโมง, 3,000 ช่อง: ราว 4 ปี | 1 วัน, 2,284 ช่อง: ราว 6 ปี |
OPNsense เก็บฐานข้อมูลเดิมไว้ตลอดการอัปเกรด ดังนั้น router ที่ติดตั้งมาตั้งแต่ OPNsense รุ่นเก่าจึงยังใช้รูปแบบเดิม คอลัมน์สุดท้ายมาจาก source code ของ 26.7 ผมยังไม่เคยเห็นเครื่องที่ติดตั้งใหม่
จากตรงนี้ได้สองเรื่อง ให้อ่านข้อมูลรายนาทีของเมื่อคืนภายในเช้านี้ พอถึงตอนเย็น ข้อมูลนาทีเหล่านั้นหายไปแล้ว เหลือแต่ค่าเฉลี่ยที่หยาบกว่า และ archive รายชั่วโมงก็ยาวพอสำหรับการเทียบก่อนและหลังที่คุณไม่ได้วางแผนไว้ ของผมมีข้อมูล “ก่อน” อยู่แล้วหนึ่งเดือนตอนที่ผมติด fan
เจาะลึก: archive เก็บอะไรไว้ และทำไมตัวเลขรายชั่วโมงจึงซ่อนค่าที่พุ่งขึ้นชั่วครู่
API ส่งให้แค่ค่าเฉลี่ย fetchData.py ของ OPNsense ประมวลผลเฉพาะ round-robin archive ที่มี consolidation function เป็น AVERAGE และสร้าง “set” หนึ่งชุดต่อหนึ่ง archive router เก็บค่าที่อ่านจาก sensor ณ ขณะหนึ่งไว้นาทีละหนึ่งค่า ค่ารายชั่วโมงแต่ละค่าคือค่าเฉลี่ยของค่าที่อ่านได้เหล่านั้น ค่าที่อ่านได้ 91 °C เพียงค่าเดียวแทบไม่ทำให้ค่านี้ขยับ
ช่องที่ไม่มีค่า จะส่งกลับมาเป็นค่าว่าง สคริปต์เดียวกันตัดช่องที่ไม่มีค่าออกเฉพาะที่จุดเริ่มต้นของ series ดังนั้นจำนวนช่องจะน้อยกว่าความยาวของ archive เมื่อช่องที่เก่าที่สุดว่าง เช่นในฐานข้อมูลที่เพิ่งสร้าง snippet ด้านล่างรายงานจำนวนค่าที่อ่านได้และจำนวนช่องที่ไม่มีค่าแยกกัน
เจาะลึก: console snippet สำหรับสรุปข้อมูล router ของคุณเอง (สำหรับ PC)
กราฟ Health แสดงรูปร่างของข้อมูล snippet นี้พิมพ์ตัวเลขออกมา: ค่าเฉลี่ย ค่ามัธยฐาน เปอร์เซ็นไทล์ที่ 95 และค่าสูงสุด และจำนวนค่าที่อ่านได้ที่ถึง 80 °C ของ archive หนึ่ง snippet นี้ส่งคำขออ่านหนึ่งครั้ง (GET) ไปที่ health API ของ router เอง และไม่เปลี่ยนแปลงอะไร
ก่อนเริ่ม
- คุณต้องมี PC ที่มี Chrome หรือ Firefox และ login เข้า web interface ของ router ที่เปิด Reporting → Health ได้
- คุณพิมพ์ใน developer console ของ browser บนหน้าของ router เอง คุณไม่ต้องติดตั้งอะไร
- ใช้เวลาสองถึงสามนาที
- ไม่เปลี่ยนแปลงอะไรบน router หรือ PC จึงไม่มีอะไรต้องย้อนกลับ ปิด console เมื่อทำเสร็จ
- ในกล่องด้านล่าง ปุ่ม Copy จะคัดลอกทั้งกล่อง กล่องเส้นประแสดงสิ่งที่คุณควรเห็น คุณไม่ต้องพิมพ์มัน
ขั้นตอน
- เปิด web interface ของ router ใน Chrome หรือ Firefox: พิมพ์ที่อยู่ที่คุณใช้จัดการ router ลงในแถบที่อยู่ กด Enter แล้ว log in คุณควรเห็น dashboard ของ OPNsense ถ้าไม่มีหน้า login ขึ้นมา ให้ตรวจที่อยู่ และตรวจว่า PC อยู่ในเครือข่ายภายในบ้าน ถ้า browser เตือนว่าการเชื่อมต่อไม่เป็นส่วนตัว ดูหมายเหตุในข้อ 1 ของขั้นตอนดูกราฟด้านบน
- อยู่ในหน้าใดก็ได้ของ OPNsense แล้วเปิด console ของ browser: กด Ctrl+Shift+J ใน Chrome หรือ Ctrl+Shift+K ใน Firefox บน Windows และ Linux หรือกด Cmd+Option+J หรือ Cmd+Option+K บน Mac แผงจะเปิดขึ้นข้างหรือใต้หน้าเว็บ พร้อมบรรทัดสำหรับพิมพ์ ถ้ามันเปิดที่แท็บอื่น ให้คลิกแท็บ Console
-
คลิก Copy ในกล่องด้านล่าง มันคัดลอก snippet ทั้งหมด
// Paste into the browser console on any OPNsense page while logged in. // Read-only: one GET to the router's own health API. Changes nothing. (async () => { const LEVEL = 0; // archive: 0 is the finest (one value a minute); higher numbers are coarser. How many exist depends on the router. const url = '/api/diagnostics/systemhealth/get_system_health/cputemp-system/' + LEVEL; let d; try { const r = await fetch(url); if (r.status === 401) { console.log('HTTP 401: not logged in. Log in to the OPNsense web interface in this browser, then paste again.'); return; } if (r.status === 403) { console.log('HTTP 403: logged in, but this user may not read Reporting > Health. Use an account with that privilege.'); return; } if (!r.ok) { console.log('HTTP ' + r.status + ' from ' + url); return; } d = await r.json(); } catch (e) { console.log('No JSON came back (' + e.message + '). Run this on an OPNsense page while logged in.'); return; } const series = d && d.set && d.set.data && d.set.data[0]; if (!series || !Array.isArray(series.values)) { console.log('No temperature series at LEVEL ' + LEVEL + '. A higher LEVEL may not exist on this router; at LEVEL 0, check that Reporting > Health shows a CPU temperature graph.'); return; } const pts = series.values.filter(p => p[1] !== null && !isNaN(p[1])); const empty = series.values.length - pts.length; if (pts.length === 0) { console.log('The series ' + series.key + ' has no readings at this level.'); return; } const v = pts.map(p => p[1]).sort((a, b) => a - b); const n = v.length; const median = n % 2 ? v[(n - 1) / 2] : (v[n / 2 - 1] + v[n / 2]) / 2; const p95 = v[Math.min(n - 1, Math.ceil(0.95 * n) - 1)]; // nearest-rank const when = t => new Date(t).toLocaleString(); // your browser's time zone; each time marks the end of its interval console.log('Series ' + series.key + ', one value every ' + d.set.step_size + ' s'); console.log('From ' + when(pts[0][0]) + ' to ' + when(pts[n - 1][0]) + ': ' + n + ' readings, ' + empty + ' empty slots'); console.log('Average ' + (v.reduce((a, b) => a + b, 0) / n).toFixed(1) + ' °C, median ' + median.toFixed(1) + ', 95th percentile ' + p95.toFixed(1) + ', maximum ' + v[n - 1].toFixed(1)); console.log('Readings at 80 °C or above: ' + v.filter(x => x >= 80).length); })(); -
คลิกที่บรรทัดใน console วางด้วย Ctrl+V (Cmd+V บน Mac) แล้วกด Enter browser อาจบล็อกการวางลงใน console เพราะการวางโค้ดของคนแปลกหน้าลงในหน้าที่ log in อยู่เป็นกลลวงที่รู้จักกัน อ่าน snippet ก่อนจะอนุญาต ถ้า browser ขอให้พิมพ์ “allow pasting” ให้ทำตามข้อความนั้น แล้ววางอีกครั้ง
-
ภายในหนึ่งหรือสองวินาที คุณควรเห็นสี่บรรทัด (ไม่ต้องสนใจบรรทัดที่ขึ้นต้นด้วย “Promise”): ชื่อ series ช่วงเวลาพร้อมจำนวนค่าที่อ่านได้และจำนวนช่องที่ไม่มีค่า ตัวเลขสรุป และจำนวนค่าที่อ่านได้ที่ 80 °C ขึ้นไป เวลาที่แสดงเป็นเขตเวลาของ browser ของคุณ และแต่ละเวลาคือจุดสิ้นสุดของช่วงนั้น บน router ของผม เมื่อวันที่ 28 ตุลาคม 2026 มันพิมพ์ออกมาว่า (ผมตัดเวลาออก รูปแบบของเวลาเป็นไปตามการตั้งค่าของ browser ของคุณ):
Series cpu0temp, one value every 60 s From <start time> to <end time>: 1000 readings, 0 empty slots Average 43.9 °C, median 47.7, 95th percentile 57.8, maximum 72.5 Readings at 80 °C or above: 0 -
“HTTP 401” แปลว่า browser ยังไม่ได้ log in เข้า OPNsense: ให้ log in แล้วทำข้อ 4 ซ้ำ “HTTP 403” แปลว่าคุณ log in ด้วย user ที่ไม่มีสิทธิ์เข้า Reporting → Health
- หากต้องการอ่าน archive รายชั่วโมง ให้วาง snippet ลงใน text editor ธรรมดาก่อน (Notepad บน Windows, TextEdit ที่ตั้งเป็น plain text บน Mac) เปลี่ยน
const LEVEL = 0;เป็นconst LEVEL = 2;คัดลอกทั้งหมดจากตรงนั้น แล้วทำข้อ 4 และ 5 ซ้ำ - เทียบค่าเฉลี่ยกับระดับของเส้นกราฟ Reporting → Health ของ archive เดียวกัน ทั้งสองควรตรงกัน
- เมื่อทำเสร็จ ให้ปิดแผงด้วย × ที่มุมขวาบน router ไม่ถูกเปลี่ยนแปลงอะไร
คำตัดสิน
เคสยังปิดอยู่ และ paste ก็ยังอยู่ในกล่อง
สิ่งที่เหลือเป็นงานเล็ก ยึด fan และยกมันขึ้น: ขายางสูง 10 ถึง 15 mm จะยึด fan ไว้กับที่ และให้ลมไปถึง fins ที่อยู่ใต้ดุมของมัน ซึ่ง fan ที่วางราบทำให้ขาดลม นั่นเป็นวิธีปฏิบัติทั่วไปสำหรับ fan ที่วางเหนือ heatsink ผมยังไม่ได้วัดผลกับเครื่องนี้ ดูแลไม่ให้มีอะไรบังตะแกรงข้างตู้ ตัวตู้ทั้งตู้เป็นอีกปัญหาหนึ่ง: fan ทำให้ router เย็นลงได้แค่เข้าใกล้อุณหภูมิของอากาศในตู้ ซึ่งอุ่นกว่าห้อง ผมไล่คิดเรื่องนั้นแยกต่างหาก และอาจเขียนเล่าทีหลัง
ก่อนติด fan ความร้อนเป็นเหตุผลให้ผมมองหา router ตัวใหม่ ตอนนี้ไม่ใช่แล้ว
สิ่งที่ผมจะบอกคนที่มีเครื่อง fanless อยู่ในตู้ที่อุ่น
- อ่านสิ่งที่ router บันทึกไว้อยู่แล้ว ก่อนจะเปิดอะไร บน OPNsense คือ Reporting → Health หรือ API ด้านบน
- ตรวจว่าแต่ละ archive บน router ของคุณเก็บข้อมูลได้นานแค่ไหน ขึ้นกับว่าฐานข้อมูลของมันถูกสร้างเมื่อไร
- ตัดสินใจไว้ก่อนว่าผลแบบไหนจะพาคุณไปขั้นต่อไป ก่อนจะเปลี่ยนอะไร
- ตัดสินจากค่าเฉลี่ย ไม่ใช่ค่าเดี่ยว ค่ารายนาทีที่ต่อกันอาจต่างกันได้ 30 °C
- ลองวิธีที่ต้นทุนต่ำและย้อนกลับได้ก่อน และชั่งดูว่ามันมีต้นทุนอะไร: fan นำเสียงและฝุ่นมาสู่เครื่องที่ซื้อมาเพื่อไม่ให้มีทั้งสองอย่าง
อภิธานศัพท์
- การระบายความร้อนแบบ fanless (passive): ตัวเคสคือ heatsink ความร้อนออกไปทางการนำความร้อนและการไหลเวียนของอากาศตามธรรมชาติ โดยไม่มี fan
- Thermal paste / repaste: สารที่อยู่ระหว่าง CPU กับ heatsink ซึ่งเติมช่องว่างระดับจุลภาค การ repaste คือการเช็ดสารเก่าออกแล้วทาสารใหม่
- P-core / E-core: performance core และ efficient core ของ Intel ในชิปตัวเดียว Pentium Gold 8505 มีแบบแรกหนึ่งคอร์และแบบหลังสี่คอร์
- TJUNCTION: อุณหภูมิสูงสุดที่ Intel อนุญาตที่ตัวชิป สำหรับ 8505 คือ 100 °C
- PWM: pulse-width modulation สายสัญญาณที่บอก fan ว่าต้องหมุนเร็วแค่ไหน
- Round-robin database (RRD): ที่เก็บข้อมูลขนาดคงที่ ซึ่งเก็บข้อมูลล่าสุดแบบละเอียด และเก็บข้อมูลเก่าเป็นค่าเฉลี่ยที่หยาบกว่า โดยเขียนทับข้อมูลที่เก่าที่สุด
- ค่ามัธยฐาน / เปอร์เซ็นไทล์ที่ 95: ค่ามัธยฐานคือค่าที่อยู่ตรงกลาง (หรือค่าเฉลี่ยของสองค่าที่อยู่ตรงกลาง) ค่าที่อ่านได้ 95 เปอร์เซ็นต์อยู่ที่หรือต่ำกว่าเปอร์เซ็นไทล์ที่ 95
- API: ส่วนเชื่อมต่อของ router ที่ให้โปรแกรมอื่นเรียกใช้ได้ ให้ข้อมูลชุดเดียวกับที่หน้าเว็บแสดง ในรูป JSON
- Tunables: การตั้งค่า kernel ที่ OPNsense ใช้ตอน boot อยู่ในรายการที่ System → Settings → Tunables